Version 3.15.0
New Features:
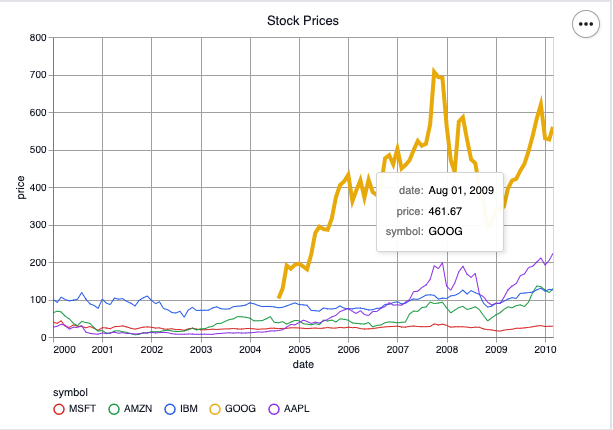
Gradio's newest plotting component gr.LinePlot! 📈
With this component you can easily create time series visualizations with customizable
appearance for your demos and dashboards ... all without having to know an external plotting library.
For an example of the api see below:
gr.LinePlot(stocks,
            x="date",
            y="price",
            color="symbol",
            color_legend_position="bottom",
            width=600, height=400, title="Stock Prices")
By @freddyaboulton in PR 2807
Bug Fixes:
- Fixed bug where the
examples_per_pageparameter of theExamplescomponent was not passed to the internalDatasetcomponent by @freddyaboultonin PR 2861 - Fixes loading Spaces that have components with default values by @abidlabs in PR 2855
- Fixes flagging when
allow_flagging="auto"ingr.Interface()by @abidlabs in PR 2695 - Fixed bug where passing a non-list value to
gr.CheckboxGroupwould crash the entire app by @freddyaboulton(https://github.com/freddyaboulton) in PR 2866
Documentation Changes:
- Added a Guide on using BigQuery with Gradio's
DataFrameandScatterPlotcomponent,
by @abidlabs in PR 2794
Testing and Infrastructure Changes:
No changes to highlight.
Breaking Changes:
No changes to highlight.
Full Changelog:
- Fixed importing gradio can cause PIL.Image.registered_extensions() to break by @aliencaocao in
[PR 2846](https://github.com/gradio-app/gradio/pull/2846) - Fix css glitch and navigation in docs by @aliabd in PR 2856
- Added the ability to set
x_lim,y_limand legend positions forgr.ScatterPlotby @freddyaboulton in PR 2807 - Remove footers and min-height the correct way by @aliabd in PR 2860
Contributors Shoutout:
No changes to highlight.
