
Install / Update
Install the dsh-context plugin on DeepSeek Harness with released NPM package:
dsh plugin --profile web add dsh-context@latestUpdate the dsh-context plugin:
dsh plugin --profile web update dsh-context@latestWhat's New
v0.76.0 rebuilds the Context Stats card as a four-lane session ledger, makes the Command Executions program ranking global and clickable, and colors command text with the harness's own shiki highlighter. It also resolves gateway model prices through canonical makers and lands a light-mode hierarchy pass plus a DNA-mode performance fix.
Features
-
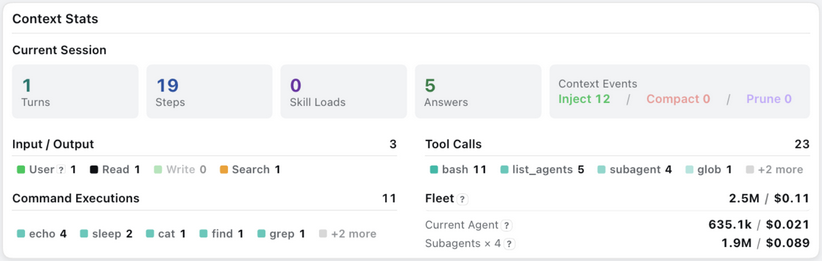
Context Stats is now a four-lane session ledger
- A KPI row for the session (turns, steps, skill loads, answers) with a per-kind Context Events filter sits above two columns: Input / Output and Command Executions on the left, Tool Calls and the Fleet cost roster on the right.
- Every chip jumps: I/O to the browser categories and File Activity, a tool to its tool-result row in the browser, a command program to the Command Executions card (scrolled in with its program seeded), and a Fleet cost row to the Fleet view.
- The three cost figures bubble their pricing details; the lanes hold their height when empty so the stacks stay level.
-
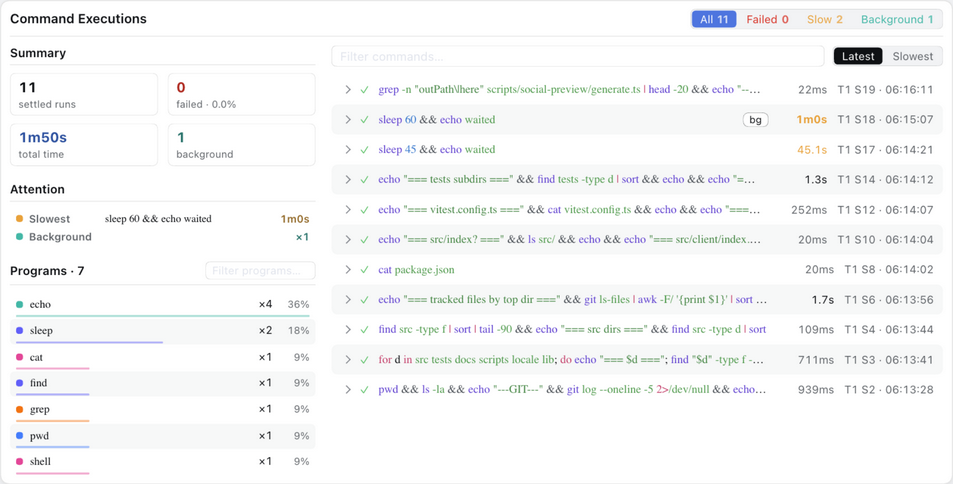
Command Executions: a stable ranking, click-to-drill, and colored commands
- The program ranking is global: the list search, status chips, and a picked program never move it. Clicking a program drills the list by head program and marks the row; clicking it again clears it. A trimmed log drops a vanished pick.
- The header chips count the search scope plus the picked program; the summary stays whole-session; the attention facts follow the current list. The Failing shortcut now uses the same program pick, so its ×N matches the rows it shows.
- bash/zsh and pwsh runs carry shiki token colors in both the row preview and the full command; run_code stays plain, and the find lens matches phrases across the colored spans.
- An empty log now shows a real zero summary, and empty attention/program sections hide.
-
Gateway prices resolve through canonical makers — model ids are indexed by provider branch, canonical lab, and an explicit bare-id fallback; subscription coding/token plan branches map to the maker's reference prices; global matching stays exact, and the tooltip reports unpriced or ambiguous reasons. The rule tree and verified examples live in docs/model-pricing-mapping.md.
-
One input-field recipe with clear and Escape — clearable text fields, native selects, and the config textarea share one border/focus treatment; textareas gain the clear control; a bare Escape clears typed content while an empty field still closes its overlay; IME and modified Escape keys pass through.
-
Light-mode hierarchy and list rhythm — a light-only surface system: tinted canvas, white cards, dsh shadow tokens, half-pixel inner lines, white expanded rows, one hover/focus recipe, and a shared zebra rhythm across event and file lists.
Performance
- DNA mode on long logs is ~8× faster to toggle — on a 987-step session the toggle drops from 686ms to 86ms and its first frame from 473ms to 119ms; the feed's peak node count falls from 11,489 to 296 while the readouts are unchanged. The row window is measured before paint, bars past 256 visible bands drop their entrance animation, and a DNA-mounted chart seeds its tight window directly.
Fixes
- Find matches phrases across text nodes — a query that crosses colored token spans, markdown, or JSON now highlights continuously instead of missing the phrase.
- The Insights stats legends keep two columns at the default sidebar width — the page gutter is sized off the pane (2.5cqi) instead of a fixed 48px.
- Fleet cost rows and tooltips — every Fleet / Current Agent / Subagents row opens the Fleet view, the whole row underlines on hover, and the row tooltips survive the click target.
- An empty Command Executions log renders zeroes — the summary rail shows real zero KPIs and the empty attention/program sections stay hidden.
Changes
- Hovering a linkable Context Events row now takes the theme's interactive wash, matching File Activity.
- The Command Executions card, its global-ranking behavior, and the refreshed settings page are documented in both READMEs with new screenshots.
Commits
- chore(release): 0.76.0 (2886f2f)
- docs: document Command Executions and refresh the settings shot (743e65c)
- fix(commands): keep the program ranking global while counts follow filters (b3649d8)
- fix(stats): restore the Fleet row tooltips (276d068)
- feat(stats): make every Fleet cost row open the Fleet view (95dbf7a)
- feat(stats): reorganize the context stats board (e5a9aca)
- docs(agents): add clarification on file coverage reporting in AGENTS.md (2219bc2)
- fix(insights): size the page gutter so the stats legends keep two columns (c97f63d)
- feat(stats): rebuild the context card as a four-lane session ledger (cf16420)
- perf(dna): keep the toggle off the whole-feed mount and the per-band animations (5742e67)
- feat(client): wash a linkable event row on hover, stepping up from the stripe (37c03a1)
- fix(find): match find marks across text nodes (3c7c198)
- feat(commands): color command text with the harness's shiki highlighter (a4e79ac)
- feat(ui): unify input fields with clear and Escape behavior (89e64f7)
- feat(ui): coordinate light-mode card hierarchy and list rhythm (a290eb8)
- fix(commands): show zero summary without empty placeholders (4343d28)
- feat(pricing): resolve gateways through canonical makers (124c919)
v0.75.1...v0.76.0 · 17 commits