Installation
Install it from the Microsoft Store: https://apps.microsoft.com/detail/9png1jddtgp8
Introducing Data Analysis and new Dashboard in AppControl Manager
AppControl Manager can now analyze the App Control for Business (Code Integrity) and AppLocker data from Event Logs or Microsoft Defender for Endpoint (MDE) Advanced Hunting. This feature is available in the Event Logs Policy Creation and MDE Advanced Hunting pages. All of the data are localized so you can change the language in the app's settings page in order to view the data in your own language.
Data Summary
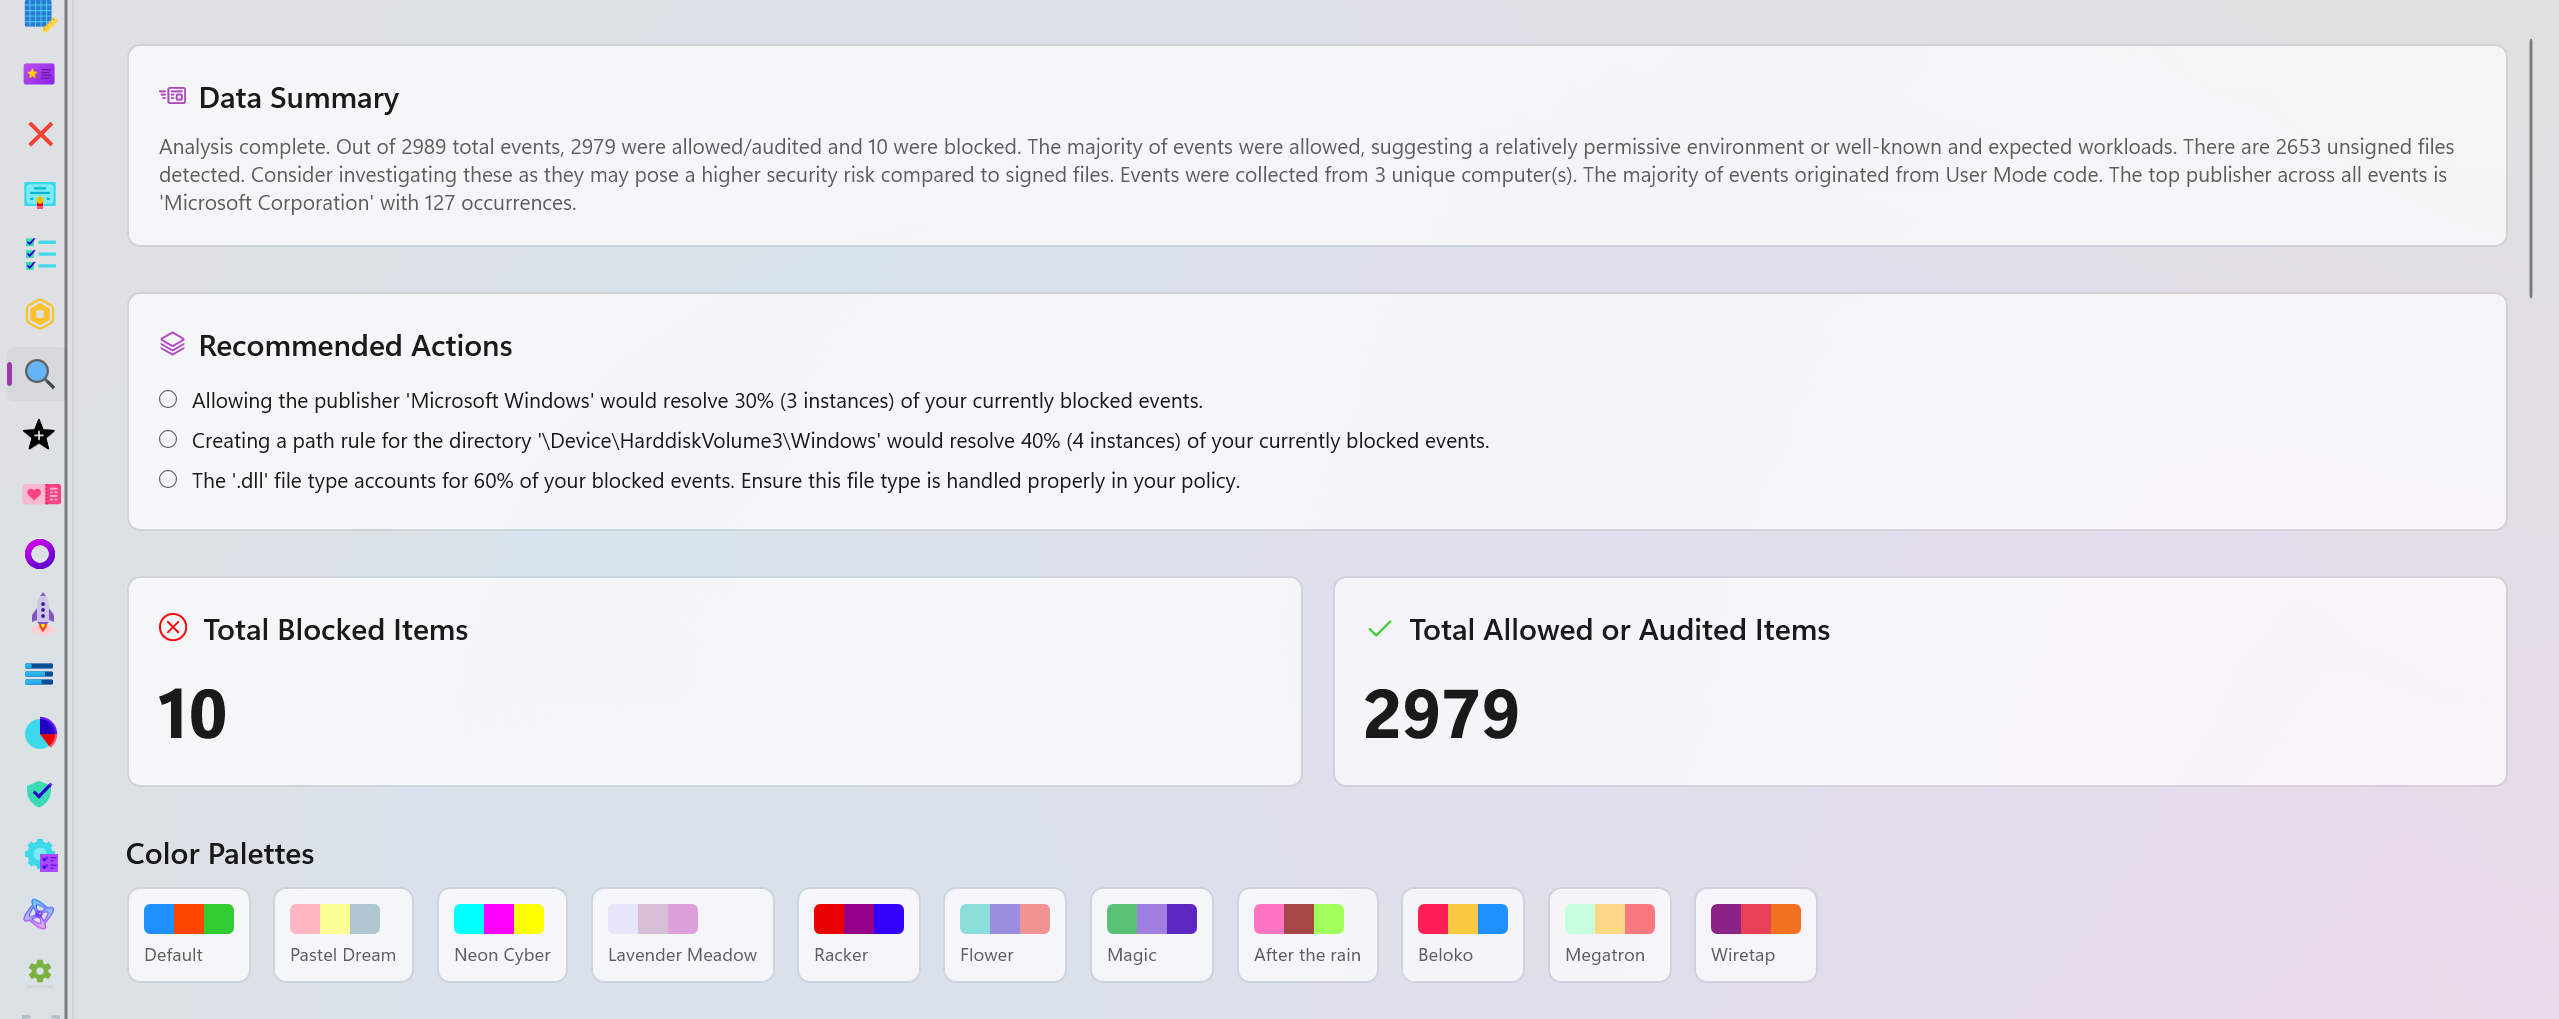
A brief overview of the available data and what they mean. It points out edge cases, provides easy to understand comparison of different data points and explains how the data is distributed in different categories.
Recommended Actions
This section will provide you with one or more recommendations based on your data. For instance, it can suggest specific policies to be deployed to resolve blocked items or recommend you to review certain parts of the logs because an excessive amount of blocked or audited events were detected in a short period of time.
Interactive Charts
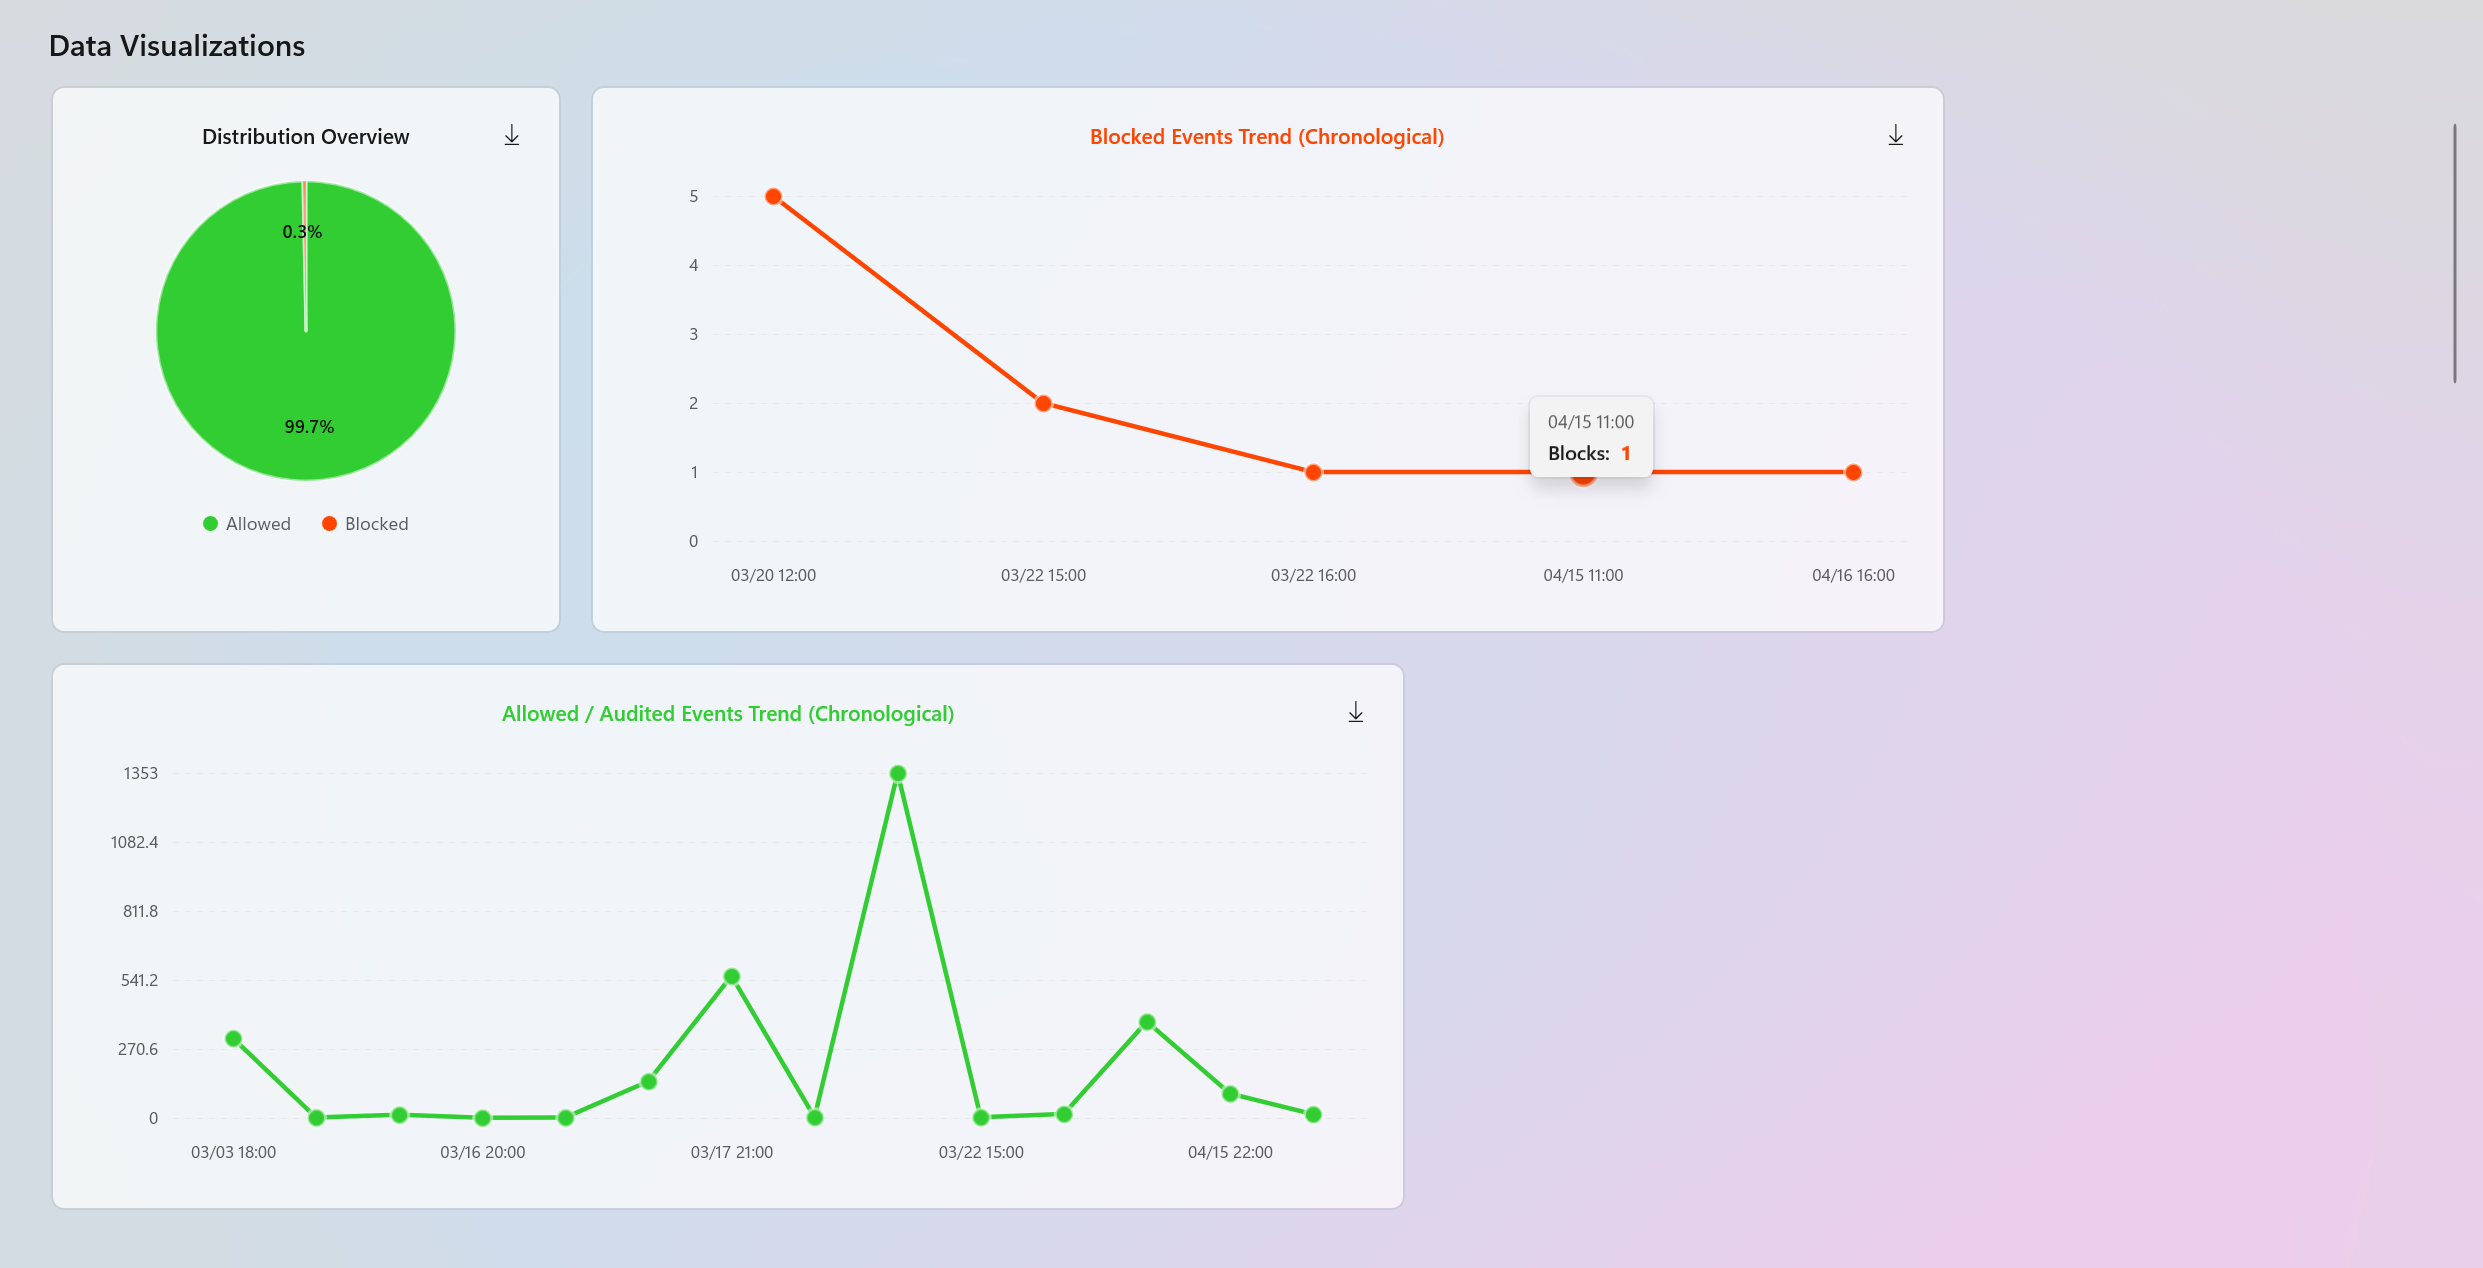
Interactive charts are dynamically generated to help with data visualization. You will have access to the entire blocked and audited/allowed trends in chronological order to quickly identify the peak points and detect anomalies. These charts have HotSpots where you can hover over or click to view additional information about specific points in time. You can also download these charts on your system as SVG files.
There is also a Pie chart displaying the distribution overview of the entire data set.
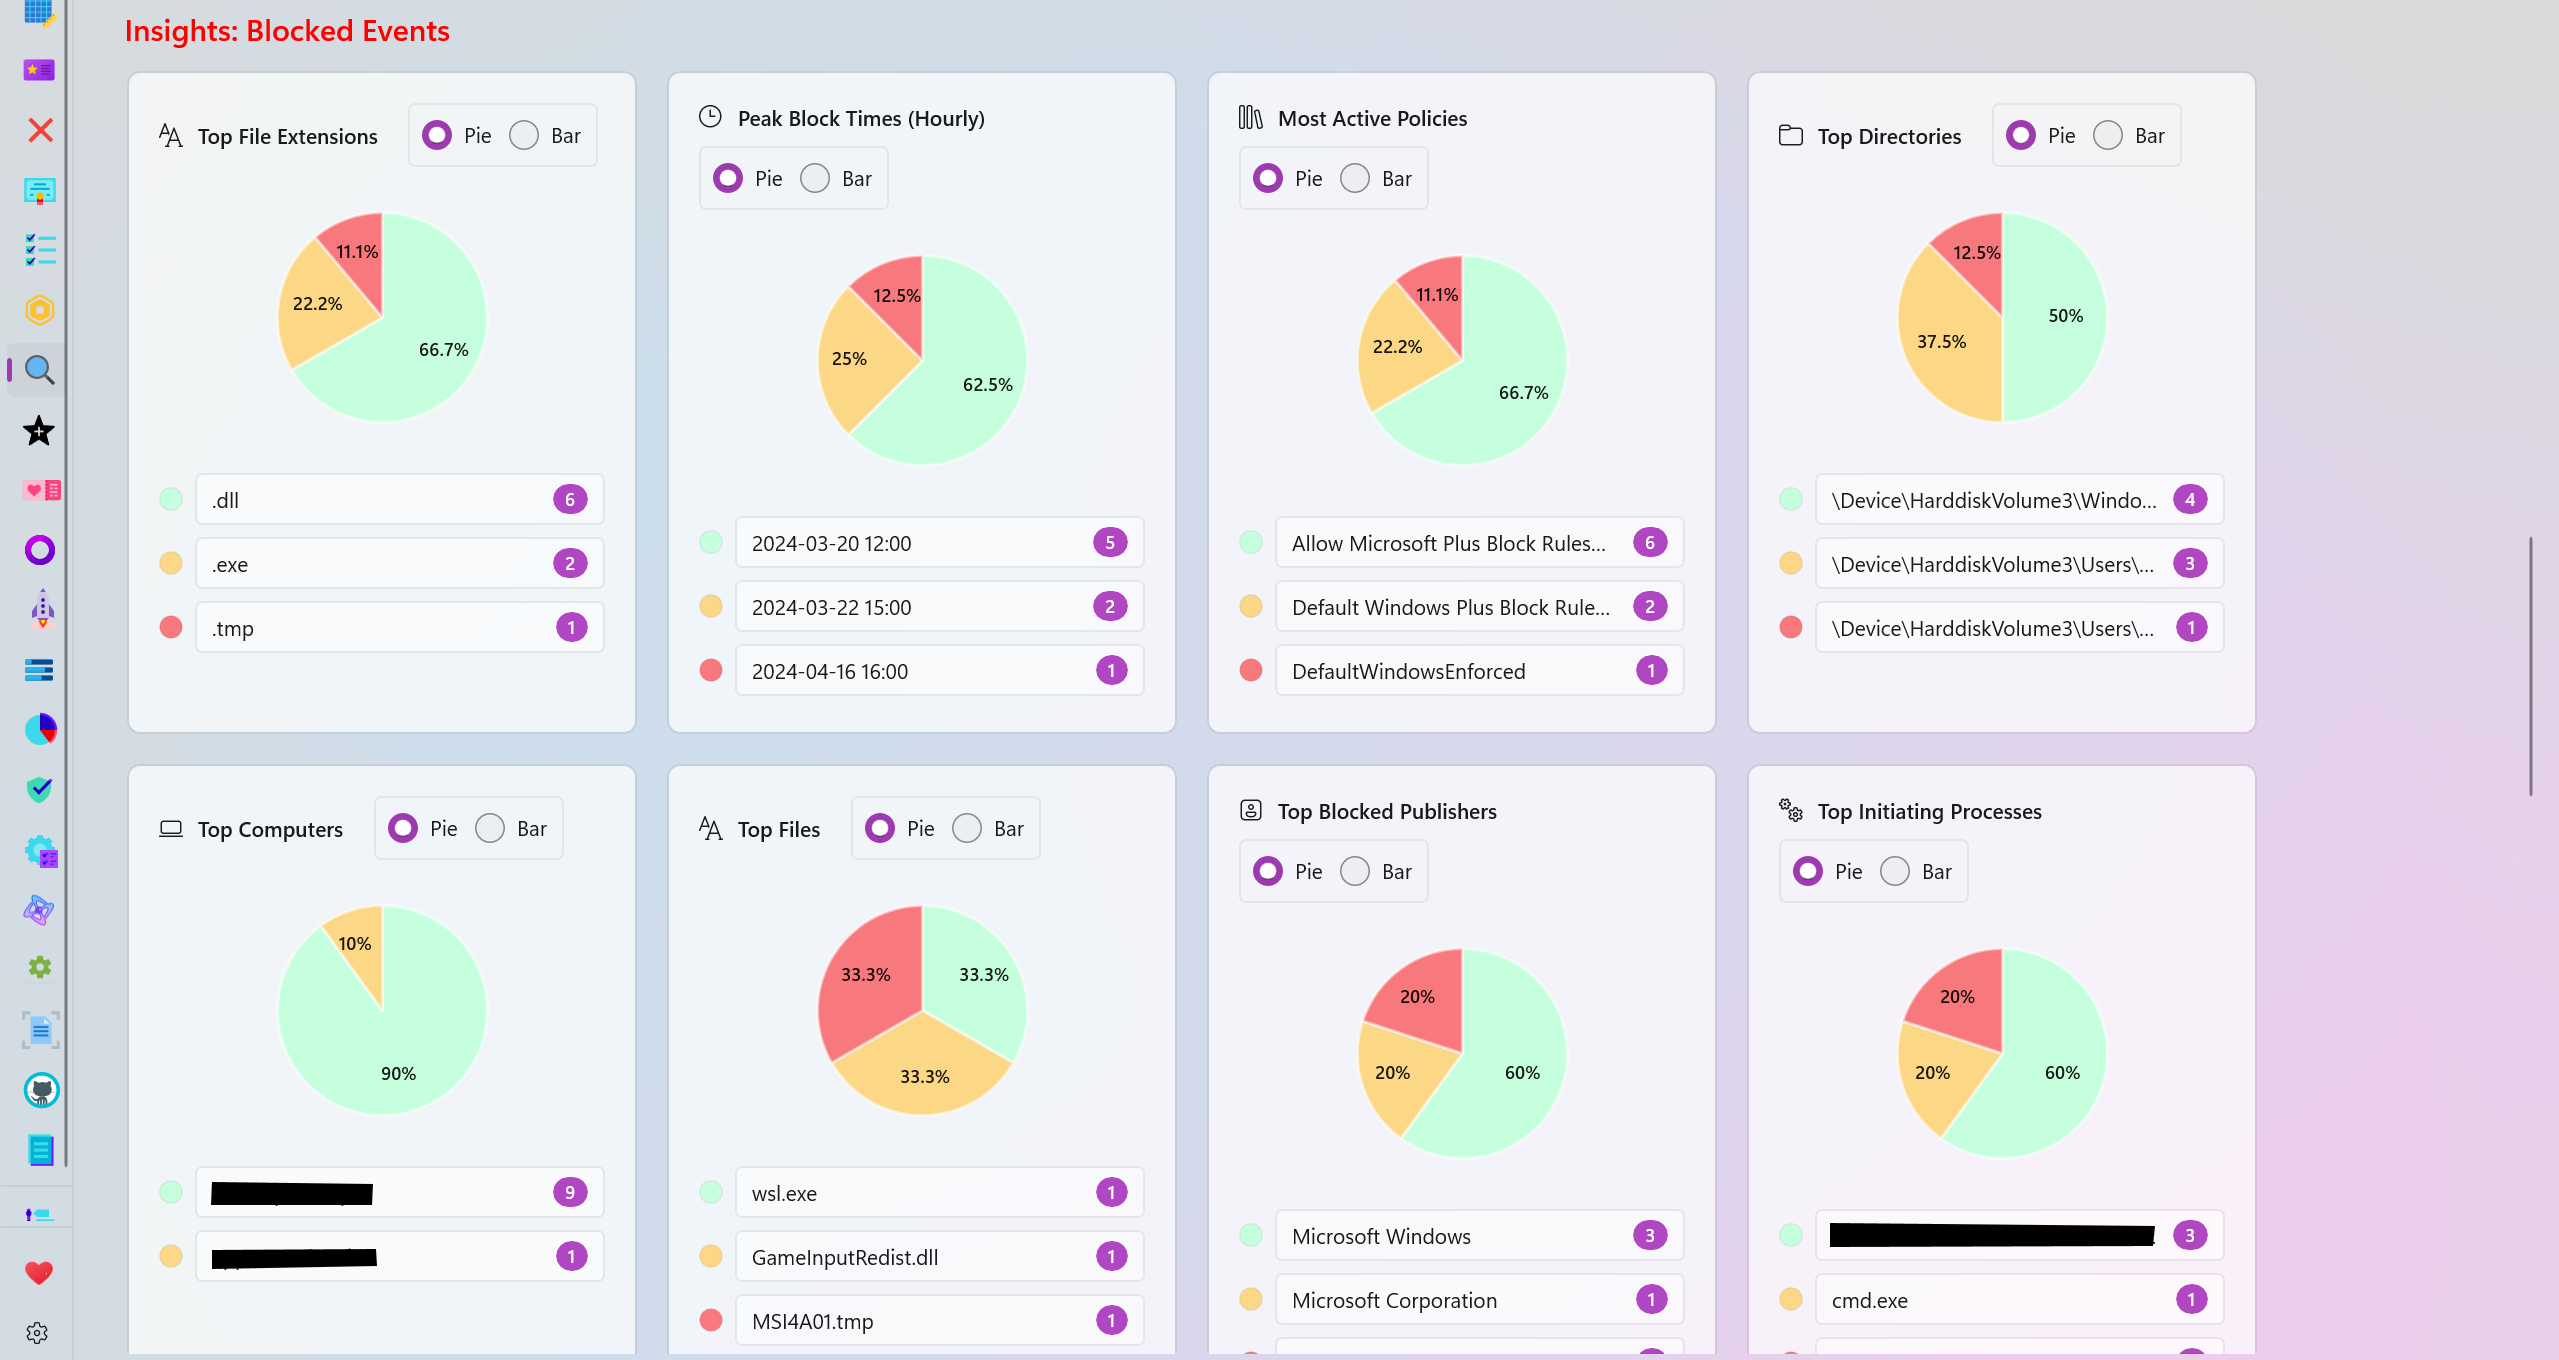
Audited and Blocked Insights
The analysis page generates many categories based on your data for further visualization of the blocked or allowed/audited data.
- Top File Extensions: View the top file extensions that were blocked or audited.
- Peak Block/Audit Times (Hourly): View the time frames where the most blocked or audited logs were generated.
- Most Active Policies: View the top most active policies responsible for generating the most blocked or audited logs.
- Top Directories: View the top directories where the most audited or blocked logs originate from.
- Top Computers: View the names of the top computers/systems that generated the most blocked or audited logs.
- Top Files: View the names of the top files that were blocked or audited the most.
- Top Publishers: View the names of the top file/program publishers that were audited or blocked the most.
- Top Initiating Processes: View the names of the processes that the most blocked or audited logs were initiated from.
- Top packaged Apps: View the top Package Family Names (PFNs) that were blocked or audited.
- Signing Scenario: View the distribution overview of the Signed vs Unsigned files among the blocked or audited logs.
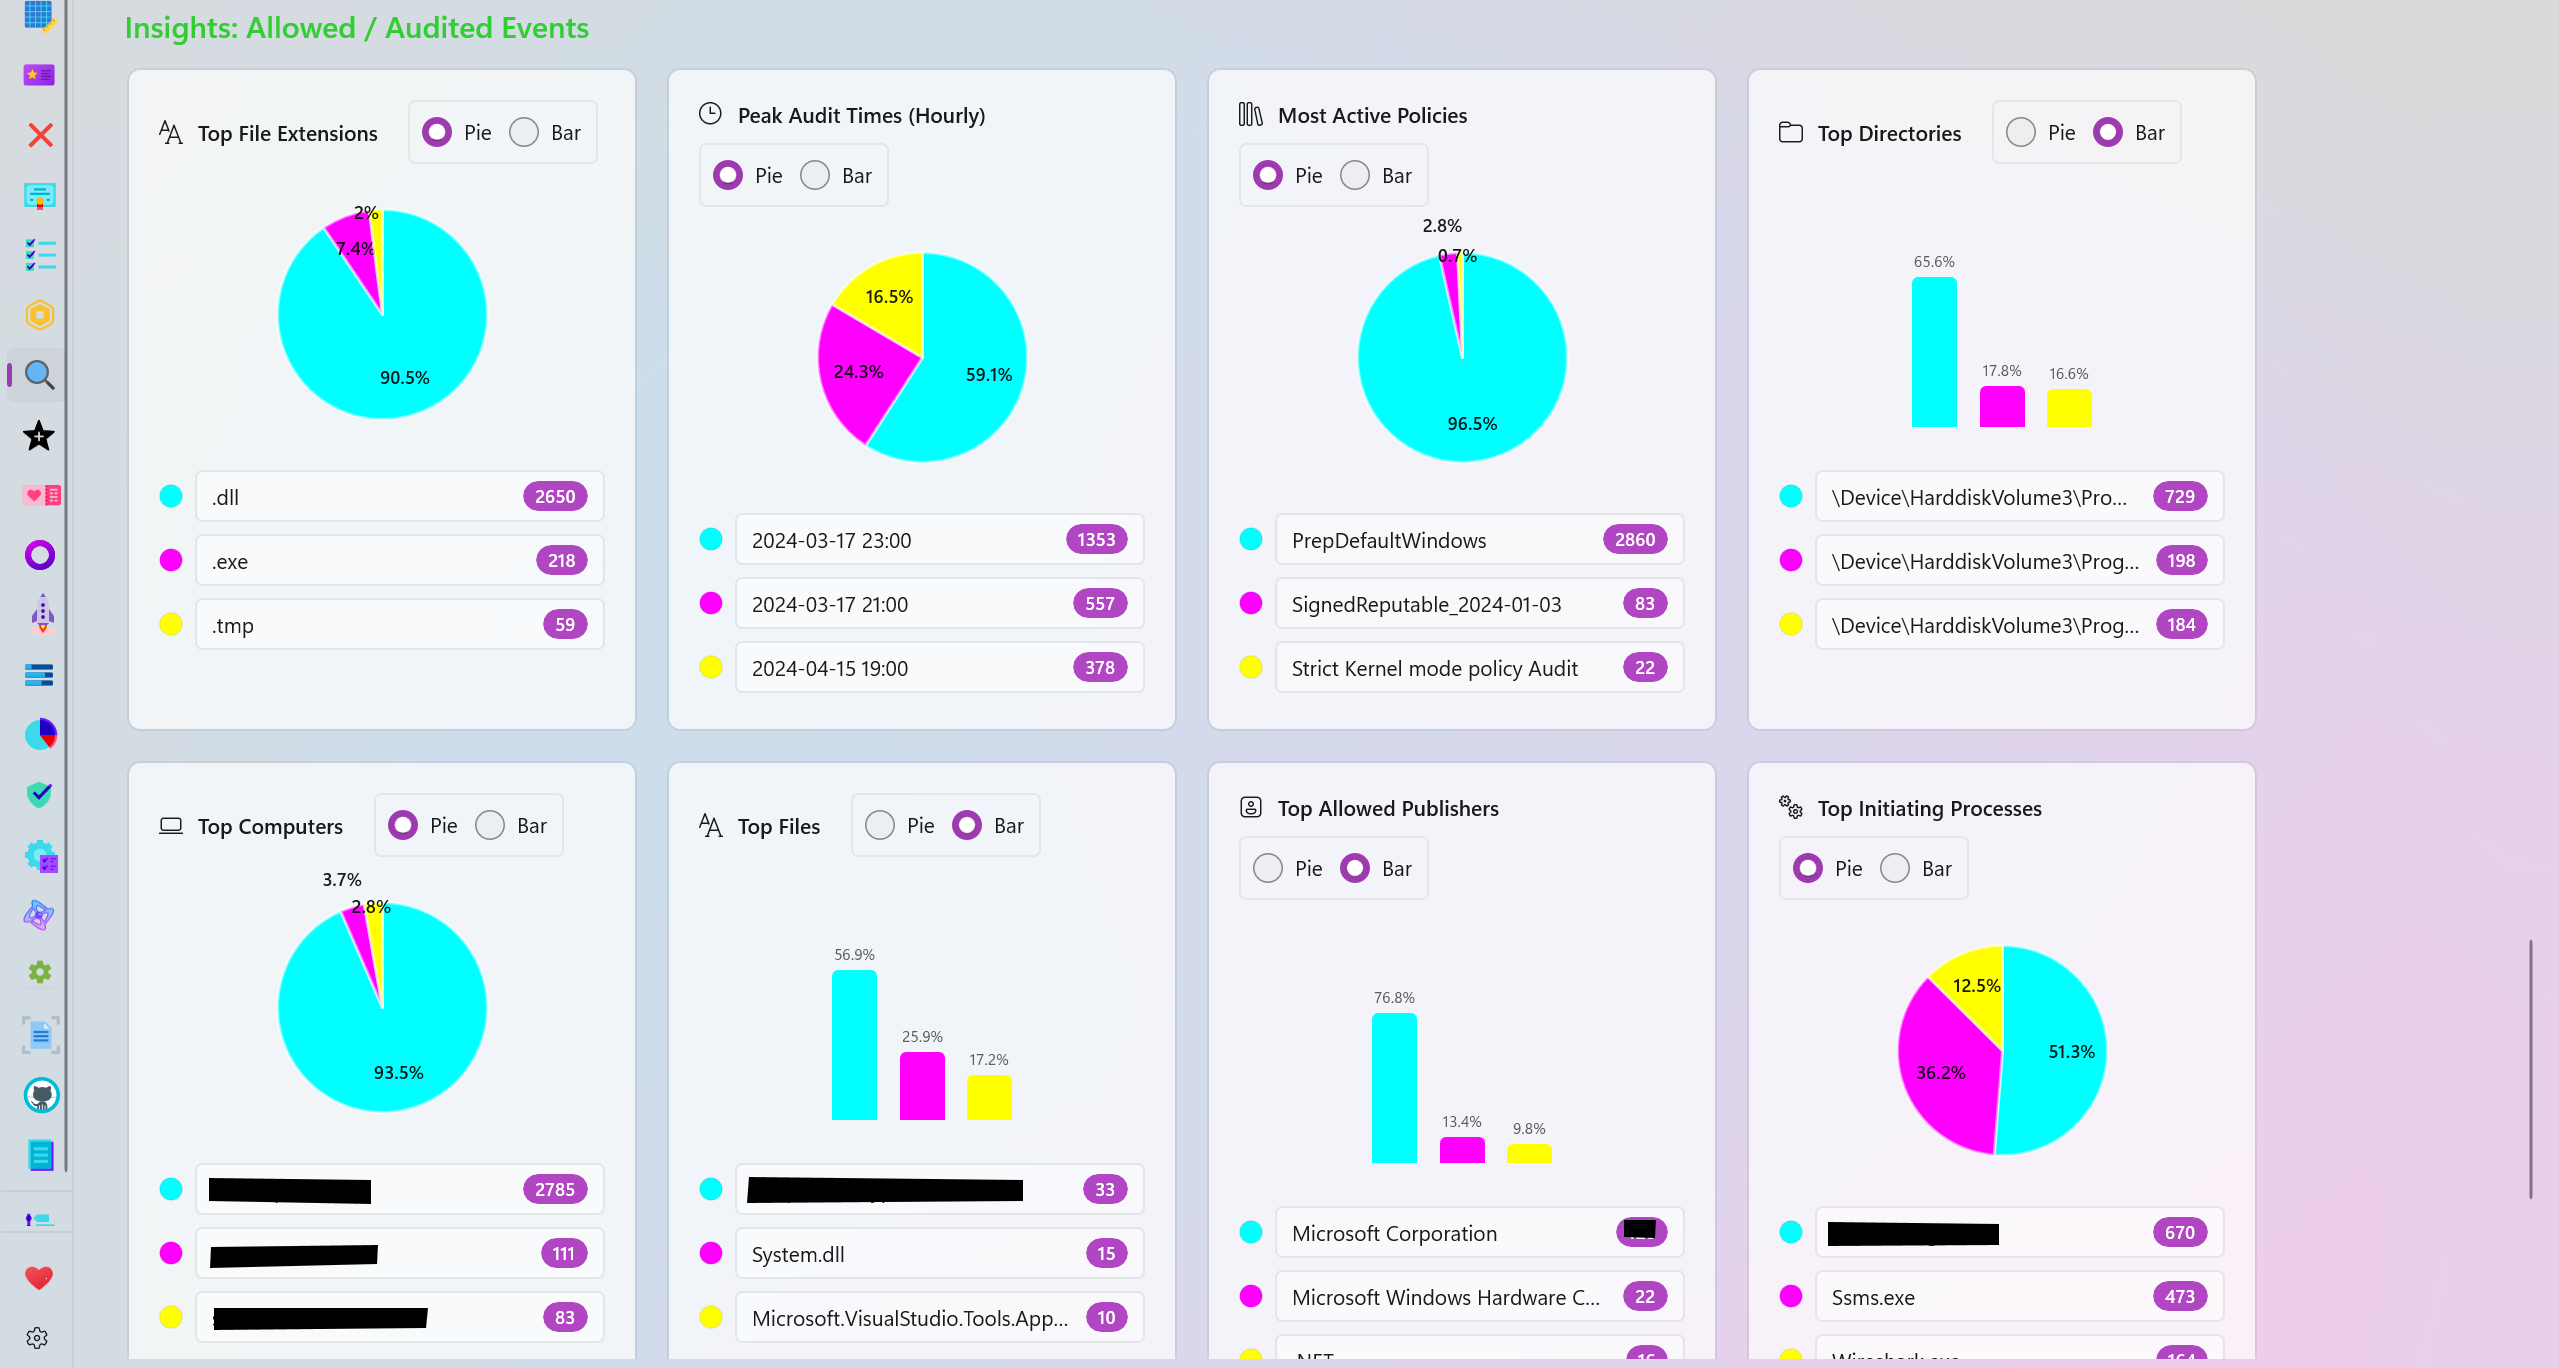
Personalization
There are multiple color palettes to choose from in order to personalize the charts available in the analysis page. Each slice of a pie or each part of a bar chart can also be individually colorized to meet your needs.
Feedback
If you have any feedback or suggestions, please don't hesitate to create a new issue or discussion on this GitHub repository.
Completed the following feature request: #568