
Highlights
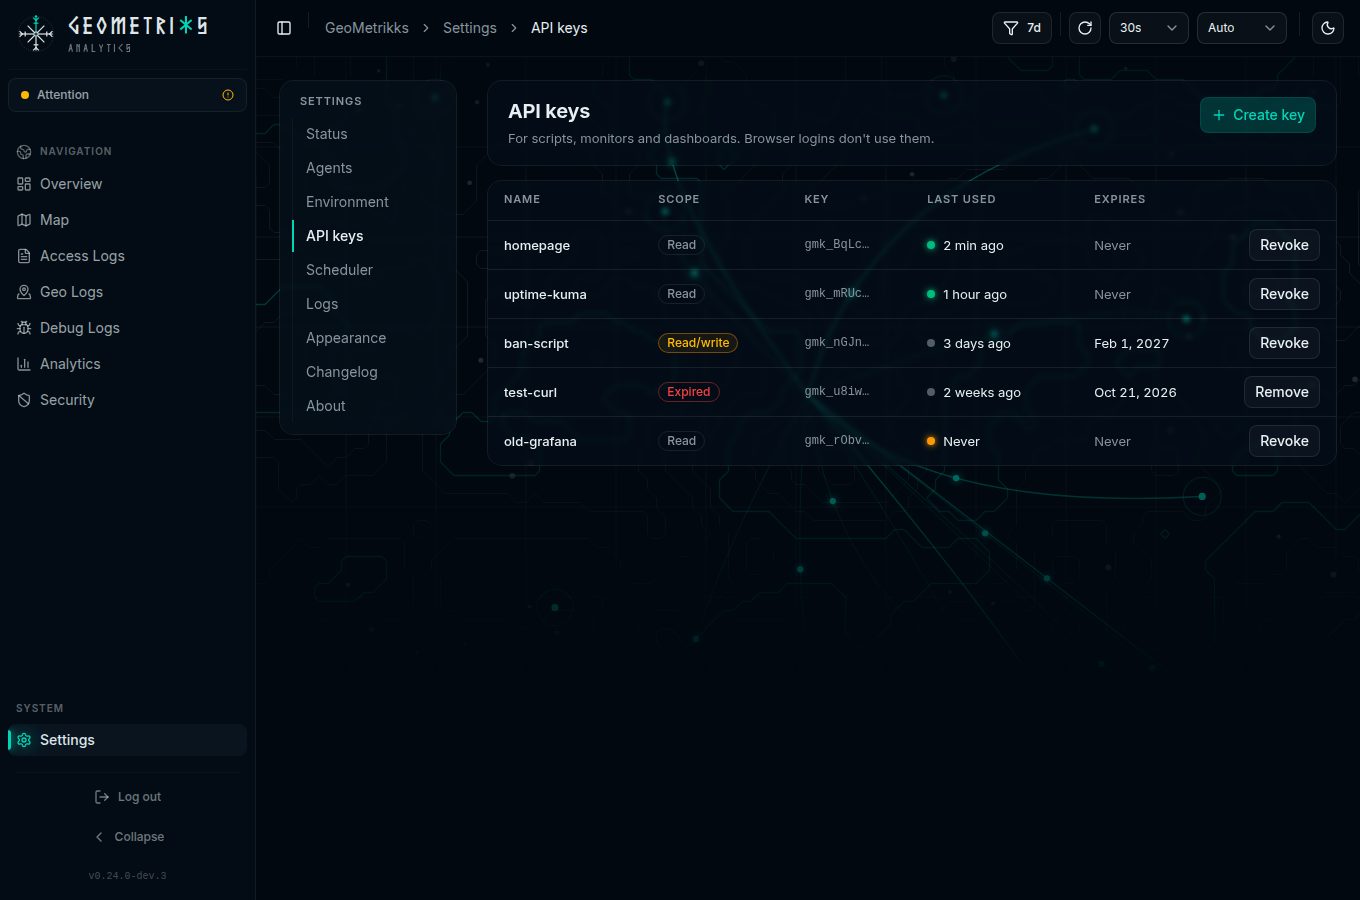
- API keys. Scripts and dashboards can call GeoMetrikks without logging in. Create Read or Read/write keys under Settings > API keys.
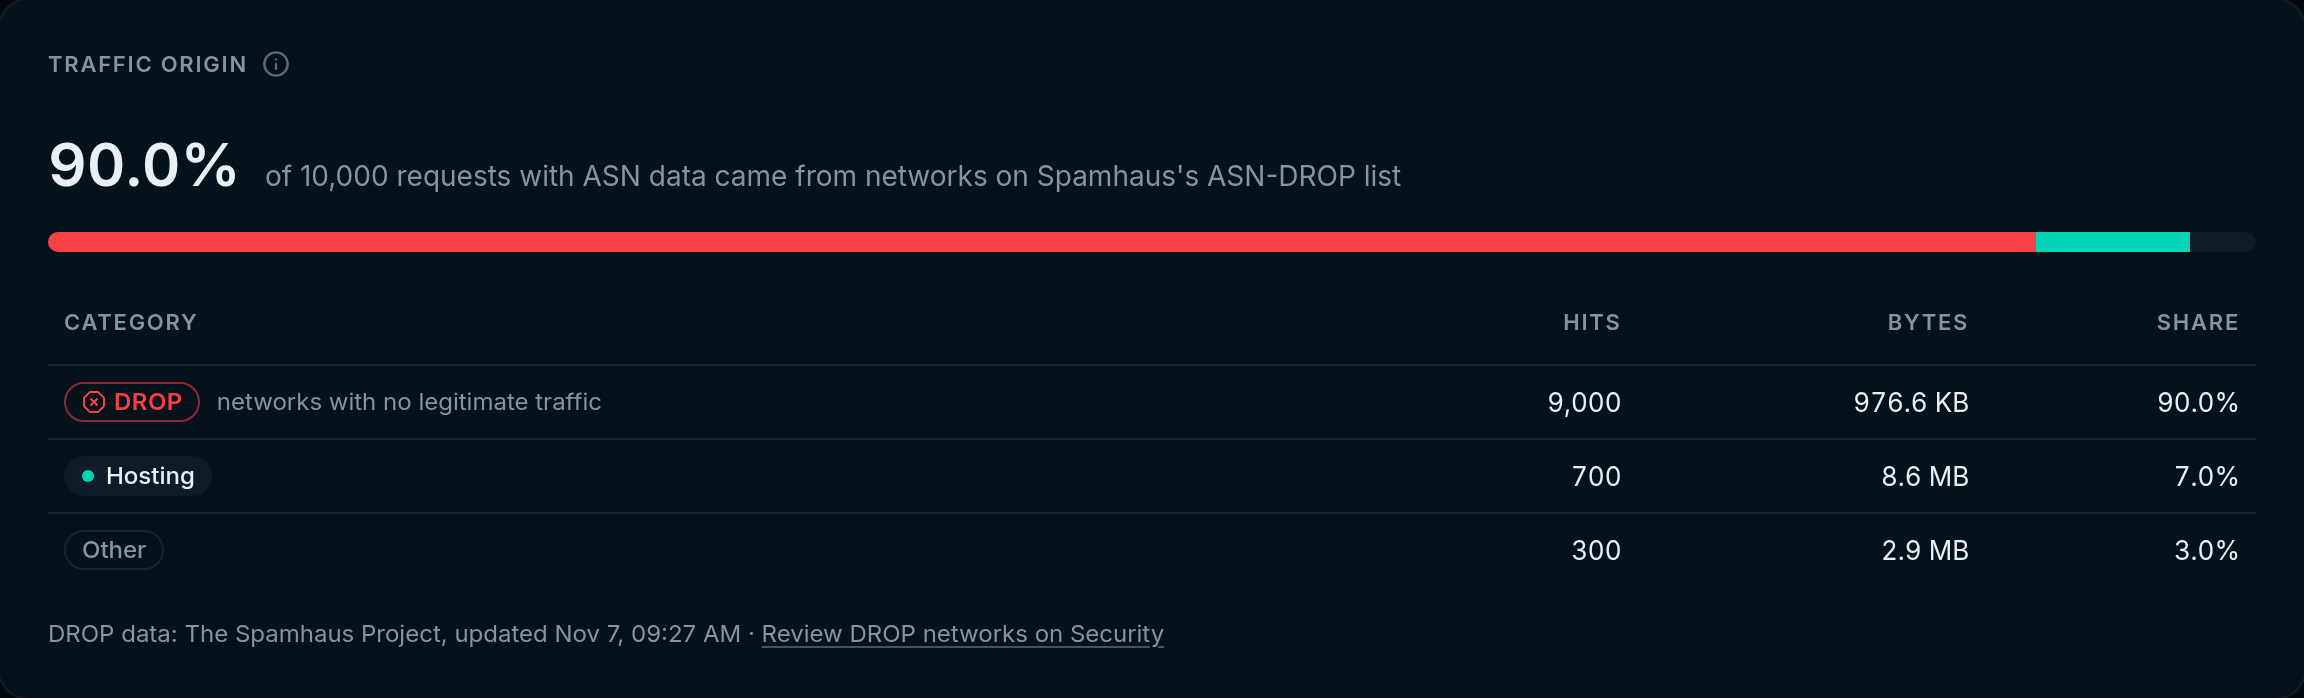
GET /api/v1/integration/summary?window=24hreturns traffic, instance health, ingestion status and active CrowdSec decisions in one call, and/schemanow documents every endpoint. - Spamhaus DROP. GeoMetrikks downloads the DROP lists of hijacked, spam and cybercrime networks once a day and marks their traffic across Analytics, the dashboard, the tables and the IP menus. The Security page lists the DROP networks in your traffic, and with CrowdSec machine credentials you can ban one network or every unbanned one at once.
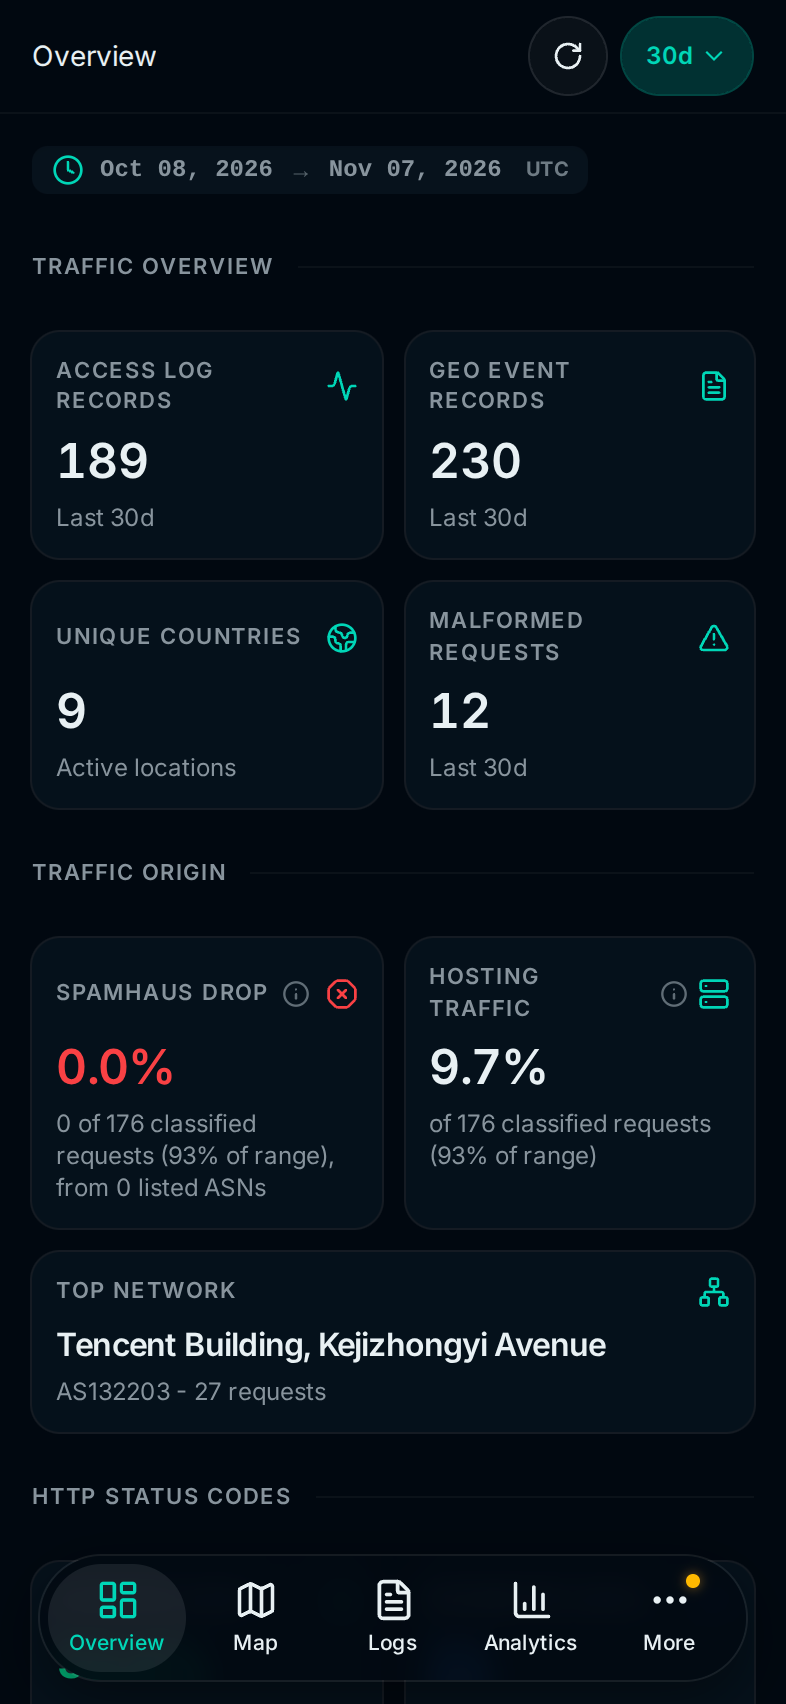
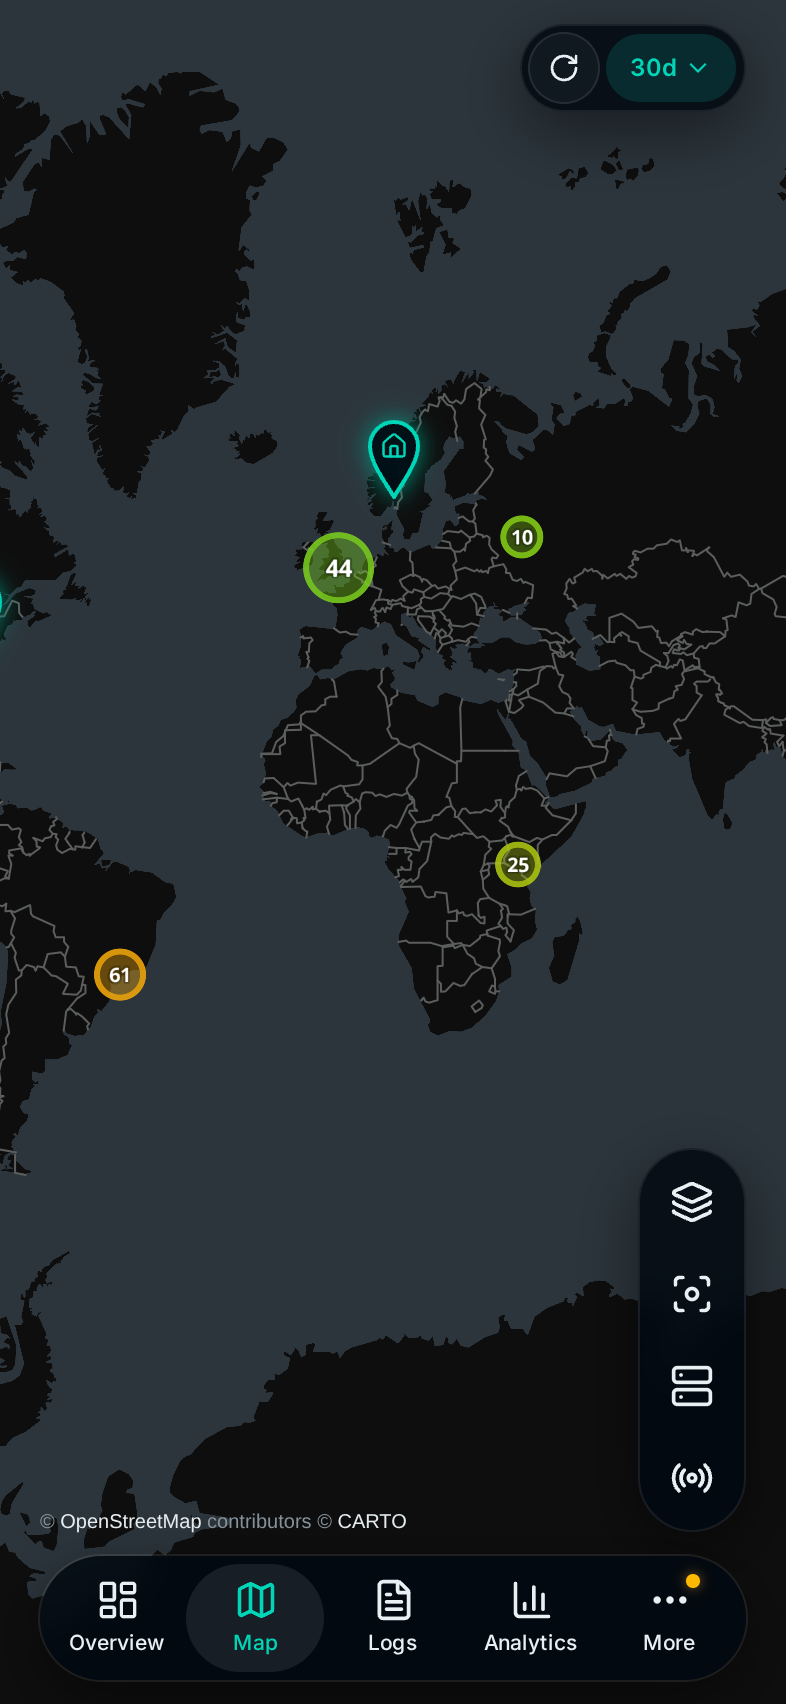
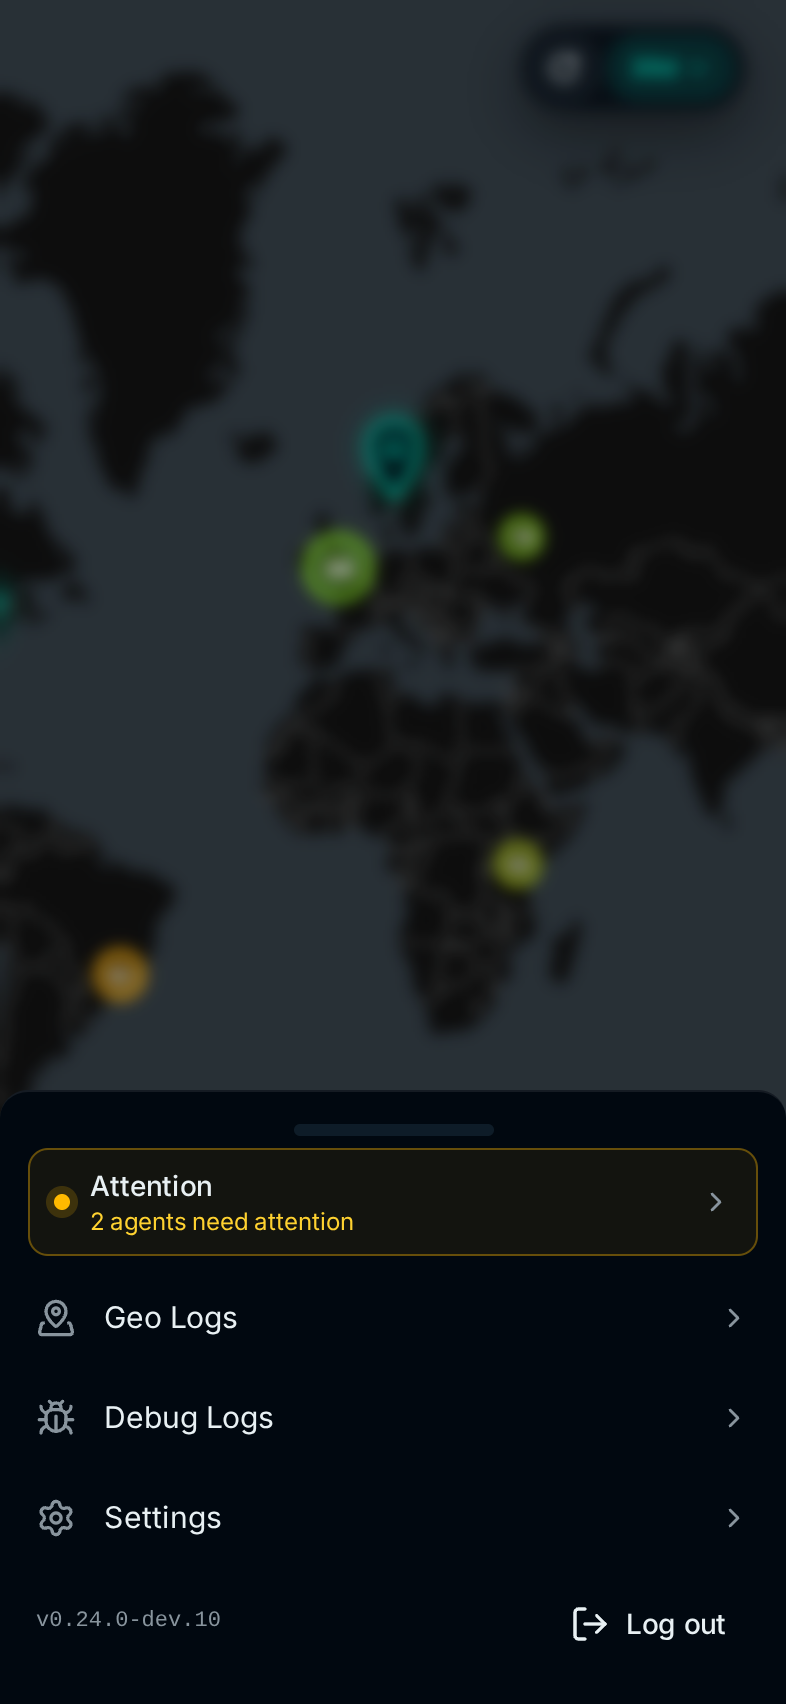
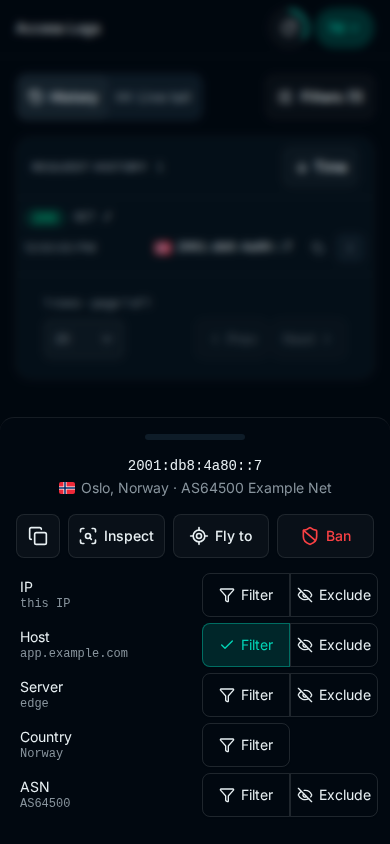
- A tab bar on phones. A floating bar with Overview, Map, Logs, Security and More replaces the sidebar. Tapping a map point opens a panel over the bottom of the map, and a phone held sideways keeps the map at full height with panels on the right. The IP menu fits on one screen, and the Filters drawer is a short list of rows.
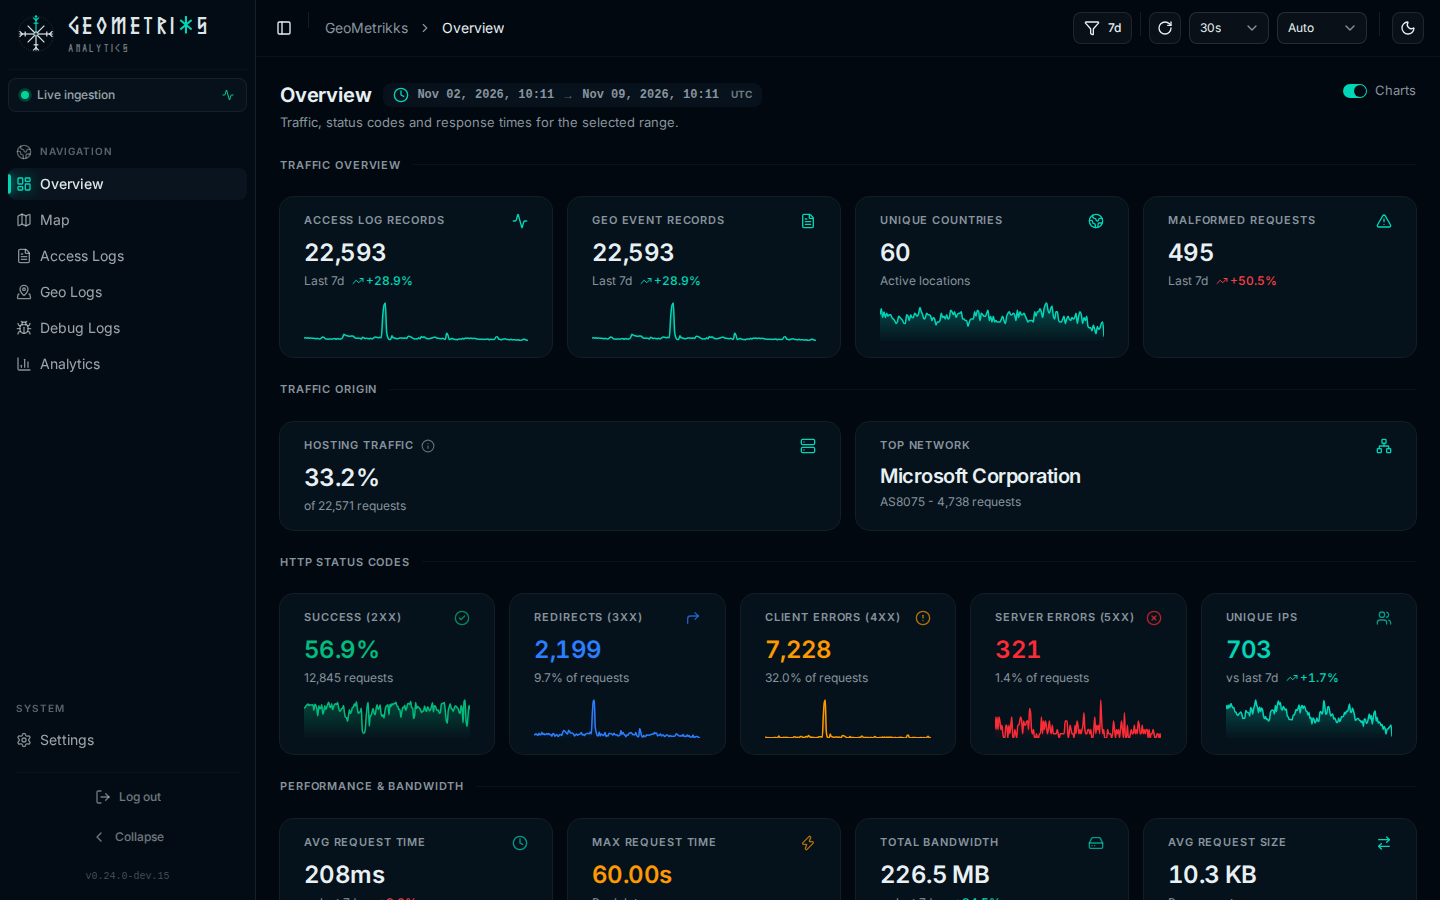
- Charts on the cards. The Overview and Geo Logs cards show how each figure moved across the range and follow the Chart buckets setting. The Charts switch in the page header turns them off.
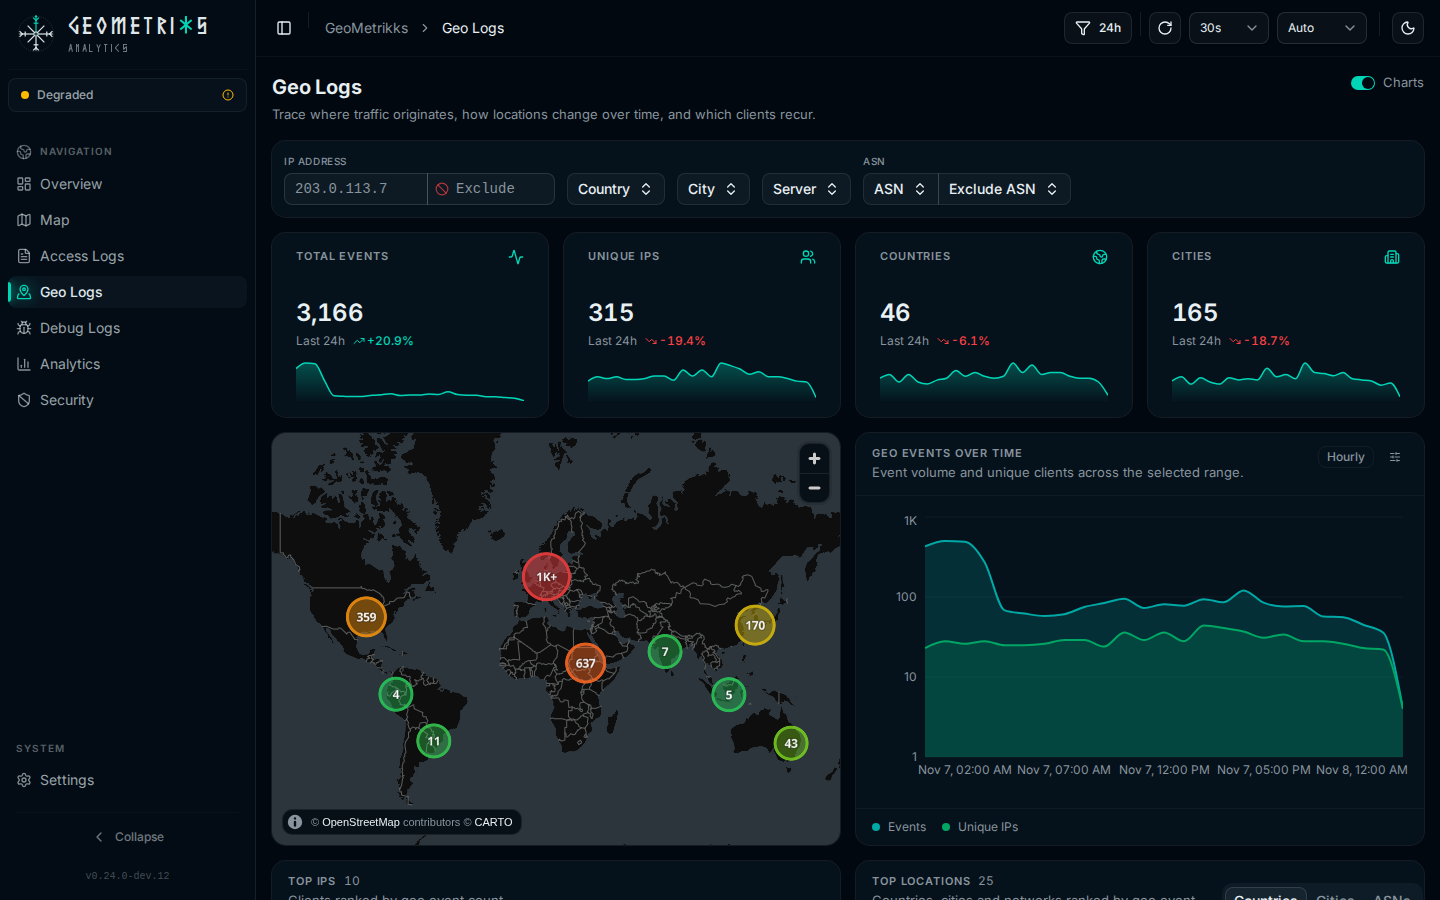
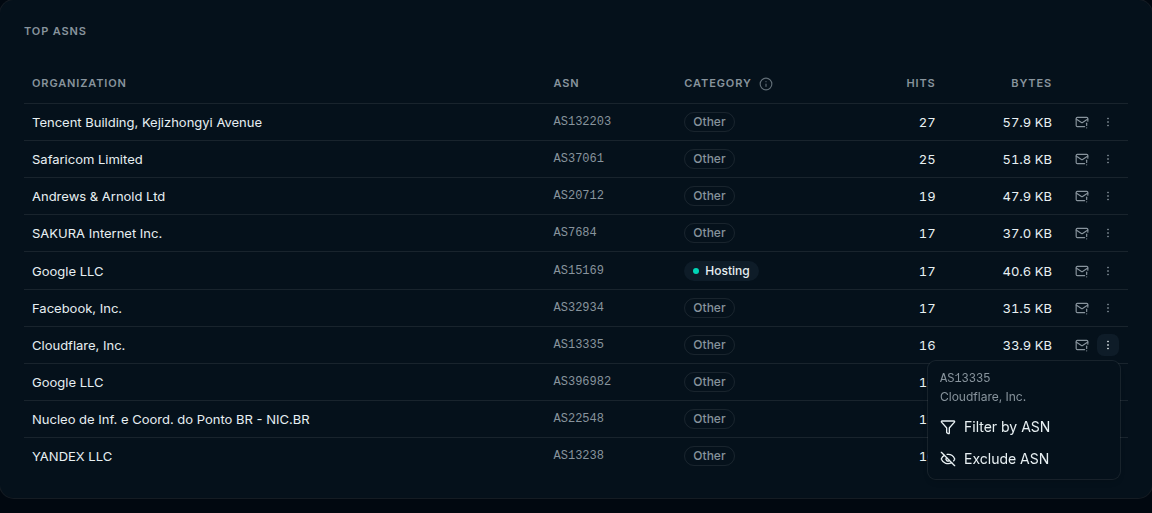
- ASN filters. Access Logs and Analytics can include or exclude ASNs, as Geo Logs can. Each row of the Top ASNs lists has a menu that filters by or excludes that network.
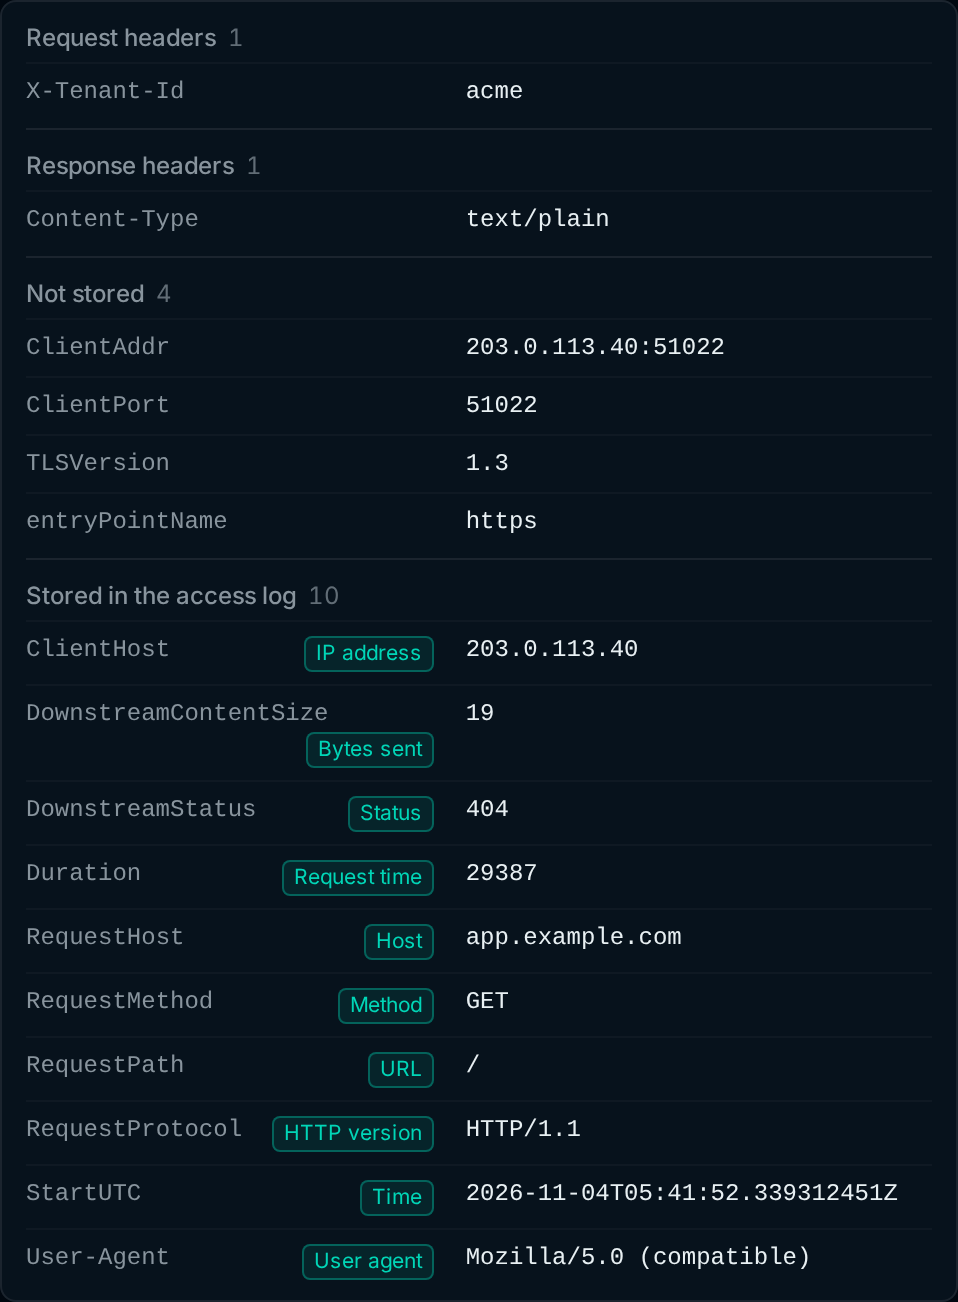
- JSON debug lines as fields. A debug line opens on one row per key, with request and response headers first and each stored key tagged with the access-log column it fills.
- Faster Analytics. On an install with 12 million log lines, the page with three IPs excluded over 180 days went from 23 to 6 seconds, and the unfiltered 30-day page from 4 to 1.4 seconds.
- Long-range totals include recent traffic. Totals and charts over ranges longer than 24 hours used to leave out the last few hours.
API keys
Spamhaus DROP
Phones
| Overview | Map | More |
|---|---|---|
| 
| 
|
Charts on the cards
ASN filters
JSON debug lines
Upgrade notes
- GeoMetrikks now downloads the Spamhaus DROP lists once a day. If you limit outbound traffic, allow
www.spamhaus.org. SetDROP_ENABLED=falseto turn this off. - API scripts:
pageSizeis capped at 1000 on/api/v1/access-logsand/api/v1/access-log-debug, and at 500 on/api/v1/geo-events,/api/v1/geo-locationsand/api/v1/crowdsec/decisions. A larger page gets a 400. - On an iPhone, add the app to the home screen again to get the map running behind the status bar.
- Daily figures for the day of the upgrade catch up by 01:00 UTC the next day.
Changelog
Added
- Scripts and dashboards can use API keys to call GeoMetrikks without logging in.
- Create keys under Settings > API keys and send one as
Authorization: Bearer gmk_.... A Read key can view data and open the live feeds, and a Read/write key can also ban, unban, run scheduler jobs and delete data. A key can have an expiry date. The list shows when and from which IP each key was last used, and GeoMetrikks shows a key only once, when you create it. A CrowdSec ban sent with a key names it in the app log, as inapi-key:homepage. - Test credentials with
GET /api/v1/auth/connection. It returns the app/API version, authentication mode, configured features and the current key's name, scope and expiry. Auth-disabled servers say so explicitly instead of claiming a supplied key was validated. - Fetch traffic, instance health, local ingestion status and active CrowdSec decisions with
GET /api/v1/integration/summary?window=24h. Sections report unavailable data explicitly, and freshness fields distinguish log time, parser activity and heartbeats. Each source in the instances API also reportslastReadAtandlastParsedAtwith its instance's heartbeat, so monitoring can detect a quiet source while others keep producing records. The Agents page shows both times for each source. - Analytics endpoints accept relative windows such as
window=24hinstead of explicit dates. Responses include the resolved bounds. Windows support whole minutes, hours or days, up to 365 days. Explicit ranges must include a timezone and have a start before their end. Missing bounds and mixed relative and explicit ranges return 400 withcode: invalid_range. - Access-log scripts can poll overlapping windows with
window=10m. Range headers let later pages reuse the same bounds. - Paged lists cap
pageSize./api/v1/access-logsand/api/v1/access-log-debugtake up to 1000 rows a page, and/api/v1/geo-events,/api/v1/geo-locationsand/api/v1/crowdsec/decisionstake up to 500. A larger page gets a 400./api/v1/geo-eventsand/api/v1/access-logsalso answer 400 for anorderByfield they cannot sort by. They used to answer 500. - API error responses add a stable
codefor scripts to distinguish expired keys, read-only keys, validation failures and unavailable services. HTTP statuses, messages and validation details keep their existing meanings. - The API reference at
/schemaexplains how to authenticate and what every endpoint does, and describes its parameters, response fields and supported sort fields. The API docs also explain client deduplication when polling and the limits for late records, imports and backfills.
- Create keys under Settings > API keys and send one as
GET /api/v1/geo-locations/{location_id}/top-ipsreturnsuniqueIps, the location's distinct IPs in the range, and gives each IP itsasnandasOrganization.- The details of a JSON debug line open on a Fields view with one row per key. Request and response headers come first, without Traefik's
request_anddownstream_prefixes, so a custom header your app sends sits at the top instead of somewhere in one long line. The keys GeoMetrikks drops follow. Every key it stores comes last, headers such asUser-Agentincluded, each tagged with the access-log column it fills. Nested keys show as dotted paths such asrequest.tls.version. The Raw tab shows the line as logged, and Copy still copies it. A line nested more than six levels deep or with more than 200 keys shows only the Raw tab, since no reverse proxy writes lines like that. - Debug Logs has a Source format column, which you turn on under Columns. A debug line's details also name the format that parsed it. Lines captured before this update show none.
- GeoMetrikks downloads the DROP lists of hijacked, spam and cybercrime networks once a day.
- Top ASNs on Analytics and Geo Logs badge these networks DROP in red. Traffic origin on Analytics gives them their own row and a red segment at the start of the bar, and its large figure shows their share when they sent more requests than Hosting. The hosting share there and on the dashboard leaves them out. The dashboard has a Spamhaus DROP card with their share of your requests and how many listed ASNs sent them. A help button on it and on the Hosting Traffic card says what each card counts.
- An IP inside a listed network gets a dashed red outline in tables and in the IP lists of map popups. When CrowdSec has a decision on the IP, the outline goes around the decision's color. Hover over it to see which DROP entry lists it. A map popup about one IP adds a Listed on row with the entry instead. Record sheets, the IP menu and the IP inspector show the same entry on a red DROP badge, and the inspector flags the address. In record sheets, the IP inspector, map popups and the Security page's DROP list, the entry links to its record on check.spamhaus.org. With CrowdSec machine credentials set, the IP menu can also ban the whole DROP network, right under Ban IP. The ban names the DROP entry as its reason. The same item unbans the network later.
- The Security page lists the DROP networks in your traffic over the last 7, 30 or 90 days, with their hits, IPs and ban status. You can ban one network there, or every unbanned one at once. That run stops if CrowdSec stops answering or after two minutes, and lists the networks it skipped. With CrowdSec set up, the help on the dashboard's Spamhaus DROP card links to this list.
- An abuse report on a listed IP or ASN adds a
Listed on:line and links each DROP entry's record on check.spamhaus.org. The dialog warns that the abuse contact may belong to the people behind the network. For an ASN, it also names the DROP networks that hold the reported addresses. The CSV addsdrop_networkanddrop_sblas its last two columns, so the existing columns keep their positions. - A DROP lists card on Settings > About shows when the lists last downloaded, how many networks and ASNs they hold, and the error from any download that failed. Installs that limit outbound traffic need to allow www.spamhaus.org. Set
DROP_ENABLED=falseto stop the downloads and hide all of this.
- Access Logs and Analytics can include or exclude ASNs, as Geo Logs can. Excluding an ASN keeps lines that have no ASN data. The IP menu on both pages can filter by the IP's ASN. Each row of the Top ASNs lists on Analytics and Geo Logs has a menu that filters by or excludes that network. With an ASN filter, the Top IPs and Top Countries / Cities cards on Analytics read raw log lines, so like the other filtered cards they cover only the last
ANALYTICS_RAW_RETENTION_DAYSdays. - The Overview cards show how each figure moved across the range in a small area chart, by hour up to 7 days and by day above. Success shows the share of 2xx responses in each bucket. Malformed Requests and the Traffic Origin cards have no chart. Ranges shorter than 6 hours show none. The Charts switch in the page header turns them off. On a phone it is Card charts in the range drawer. The browser remembers the choice.
GET /api/v1/analytics/time-seriesaddsmaxRequestTimeto each bucket. These charts follow the Chart buckets setting, which a phone now offers on the Overview too, in the range drawer. On Daily, a range of 5 days or less shows none. - The Geo Logs cards chart their figures the same way, under the page's filters. Geo Logs has its own Charts switch, so turning the charts off on one page leaves the other alone.
GET /api/v1/geo-events/time-seriesaddsuniqueCountriesanduniqueCitiesto each bucket. These charts follow the Chart buckets setting, so they always match the Geo events over time chart. On Daily, a range of 5 days or less shows none.
Changed
- The desktop sidebar stays collapsed or expanded after you reload the page. It used to open again on every load.
- On a phone, the Filters drawer is a short list of rows that show what is picked. Host, Server, Method, Status and Source format open the phone's own multi-select list. Country, City, ASN and alert scenarios open a search page in the drawer. Exclude host and Exclude server now pick from the same lists as Host and Server, so a value has to be in the list to exclude it.
- On Auto, the Geo events over time chart on Geo Logs shows a 7 day range by hour instead of by day.
- On a phone, a floating tab bar at the bottom of the screen replaces the sidebar, in both orientations. It has Overview, Map, Logs, Security and More. Logs opens Access Logs, and Analytics takes Security's place when CrowdSec is off. More holds the other pages, the service status, a pending reload and Log out, and its dot shows when one of them needs a look. Log out asks you to confirm first. The map's Layers, All traffic, Server and Live buttons sit in a small pill of icons above the bar. Hold a button to see its name. When the map is too short for all four, the pill keeps Layers and Live, and Show all traffic and Go to server move to the Map tools menu in Layers. Back closes the top panel, drawer or menu first, before it leaves the page. On a phone held sideways, Settings shows its sections as a row of chips at the top of the page. On a phone the map hides the top bar, and the refresh and time range sit in a small chip at the top right of the map. Phones used to open the sidebar from a menu button in the top bar.
- On a phone held sideways, the map keeps its full height. A tapped point's details open in a panel on the right, with the point kept in view beside it. The map controls, the live feed and the ban sheet slide in from the right. The details panel, the map controls, the live feed and the ban sheet cover the tab bar while they are open, and toasts show at the top of the screen meanwhile. Larger phones used to get the desktop map when held sideways, with its controls panel and live card covering most of it.
- On a phone, tapping a point on the map opens a panel over the bottom of the map instead of a small popup next to the point. Location, banned IP and live request details all open this way, with larger text and buttons. The map pans the point above the panel and rings it, and tapping another point switches the panel to that one. The panel covers the map's action buttons until you close it, and Ban opens its durations in a sheet at the bottom of the screen. Each IP says in words when CrowdSec has banned it, sent it a captcha or Spamhaus lists it on DROP. Tapping a marked IP opens a sheet with the decision's scenario, origin and time left, and the DROP network and entry. IPs and DROP networks have copy buttons. On the Geo Logs page the same details open in a card under the map. A location lists all its top IPs without a "more" toggle and adds its unique IPs, its share of all events, each top IP's network and a link that opens the spot in OpenStreetMap. Back in a list of banned IPs returns to the page you were on.
- Moving to another page opens it at the top, and Back takes you to where you were on the page before. A page used to open as far down as you had scrolled on the one you left.
- On a phone, the Ban an IP or range form and the Hosting ASN list on Settings > About open as sheets at the bottom of the screen instead of dialogs in the middle. The ASN list sheet is taller than the dialog was, so more networks fit on screen.
- On a phone held sideways, more panels open on the right at full height instead of as dialogs or menus that could run off the bottom of the screen. That covers the Ban an IP or range form, the IP and ASN menus, the Filters on Access Logs, Geo Logs, Analytics, Debug Logs and Security, the hosting ASN list and the new API key form. Geo Logs shows a tapped point's details in the card under the map, and a marked IP in that card opens its details and ban choices on the right. The panel covers the tab bar while it is open, and Back closes it. The IP inspector's time range picker opens as a sheet instead of a menu. Turning the phone closes an open panel, but a ban form you have started filling in and the new API key form stay open. On any phone, a log record or traceback on Settings > Logs opens as a sheet instead of a dialog, and Back closes the Filters sheet.
- On a phone, the IP menu is shorter, so you no longer scroll to reach Ban. Copy, Inspect, Fly to and Ban sit in one row of buttons at the top. Each value the page can filter on gets one row with a Filter and an Exclude button, where it used to get two rows. A pressed button shows the filter is on. Tap it again to remove the filter, or tap the other one to switch. Ban opens the durations in a second sheet, the one the map panels use. For an IP inside a DROP network, that sheet also holds the network's ban, and Unban on a banned IP opens it too. Without a DROP network, Unban still acts at once.
- The map popups on desktop show the same details as the phone panel: unique IPs, share of all events, each top IP's network, full country names and an OpenStreetMap link in place of the geohash. Every top IP is listed. Banned, captcha and DROP IPs are tinted and outlined as in the tables, and clicking one opens its decision and DROP details.
docs/configuration.mdputs the settings most installs need first: login, database, the logs to read and GeoIP. Each optional feature follows with its own section. The 28 settings for pool sizes, poll intervals, timeouts and log rotation sit in an Advanced tuning section near the end. Almost every install can leave them at their defaults.- The abuse report dialog keeps its title and its Download and Copy buttons in place while the rest scrolls, and its preview box is shorter. On a phone the title takes less room and the two buttons sit side by side.
- Analytics loads faster, most of all with a filter over a long range. On an install with 12 million log lines, the page with three IPs excluded over 180 days went from 23 to 6 seconds, and the unfiltered 30-day page from 4 to 1.4 seconds. A filtered chart now estimates its p50, p95 and p99 latency the same way an unfiltered chart always has.
- Stat cards on the Overview, Security, Geo Logs and Debug Logs pages are 24 pixels shorter on tablets and desktops, with less empty space between the title and the number.
Fixed
- On a phone, tapping a badge shows the text a desktop shows on hover, such as what Hosting ASN means in the IP inspector.
- The map runs behind the status bar in the app installed to an iPhone's home screen, instead of stopping below a solid band. Add the app to the home screen again to get this.
- On an iPhone, the text field you tap in a drawer stays visible above the keyboard.
- Totals and charts over ranges longer than 24 hours include the last few hours of traffic. The aggregate refresh that runs every six hours also counted the day and the hour still in progress. Requests that arrived after it were left out of daily figures until the next day and of hourly ones for up to two hours. On an install that ran an earlier version, the daily figures for the day of the upgrade catch up by 01:00 UTC the next day.
- On ranges over 24 hours,
GET /api/v1/analytics/summaryreturns request counts, status counts and the error rate as numbers. They used to come back as strings, and the Overview failed with a 500 when one of the two periods it compares had no requests. - On a phone held sideways, the header and side panels such as the IP inspector stay clear of the notch.
- On a develop image, View on GitHub on Settings > Changelog opens the changelog on the develop branch. It used to open the main branch, which lacks the changes listed under Unreleased.
- Startup no longer logs
`uuid-utils` not installed, falling back to `uuid4` for UUID v7 generation. - CrowdSec ban and unban lines in the app log name the admin by username. They used to print
AdminUser(username='admin', provider='password'). - In a record sheet, a long ban reason wraps with the time left at its end. The time left used to sit beside the reason's first line while the rest of the reason wrapped underneath.
- On a phone, a long IPv6 address in the abuse report's title wraps onto a second line. It used to make the dialog scroll sideways.
- If you used Fly to on the map or Show on map and then went Back or opened another page before the map finished loading, that page turned into the map when the map's data arrived. You now stay on the page you went to.
- Selecting a banned IP in a table selects only the IP. Chrome's right-click menu used to add the hidden screen reader label. A search or a browser extension such as AbuseIPDB's then got
35.210.200.212(Banned). - On a phone, the ⋮ button at the bottom of a record sheet opens the IP actions from the bottom of the screen, or from the right on a phone held sideways, as the ⋮ in a table row does. It used to open the small desktop menu.
- On a phone, the shield beside the IP in the IP inspector opens the ban durations from the bottom of the screen, or from the right on a phone held sideways, as Ban in the IP menu does. It used to open the small desktop menu.
What's Changed
- docs: sort the configuration reference into four tiers by @GilbN in #394
- chore(agents): declare the plugin marketplaces and Codex rules this repo uses by @GilbN in #395
- feat(debug-logs): show JSON debug lines as grouped fields by @GilbN in #396
- feat(debug-logs): record each debug line's source format by @GilbN in #397
- fix(abuse-report): stop a long IPv6 address from scrolling the dialog sideways by @GilbN in #399
- feat(drop): show traffic from DROP-listed networks in Analytics and the dashboard by @GilbN in #398
- feat(drop): mark DROP-listed IPs and ban DROP networks through CrowdSec by @GilbN in #400
- feat(drop): flag DROP listings in abuse reports by @GilbN in #401
- feat(auth): let scripts and dashboards call the API with revocable keys by @GilbN in #404
- fix(deps): install uuid-utils so startup stops warning about UUID v7 by @GilbN in #405
- docs(api): explain the API in the /schema reference by @GilbN in #406
- fix(api): answer 400 for bad sort fields and cap page sizes by @GilbN in #407
- feat(api): give scripts stable error codes by @GilbN in #408
- feat(api): accept relative analytics windows by @GilbN in #409
- feat(api): let integrations verify their connection by @GilbN in #410
- feat(api): summarize traffic and health for integrations by @GilbN in #411
- feat(api): let scripts poll recent access logs by @GilbN in #412
- feat(ingestion): report activity for each log source by @GilbN in #414
- docs: group API changelog entries by @GilbN in #415
- fix(changelog): link develop images to the develop changelog by @GilbN in #417
- perf(analytics): cut a filtered 180-day Analytics load from 23s to 6s by @GilbN in #418
- feat: filter Access Logs and Analytics by ASN by @GilbN in #419
- feat(map): readable map details on phones, and the same details on desktop by @GilbN in #420
- feat(ui): open the ban form and hosting ASN list as bottom drawers on phones by @GilbN in #421
- fix(analytics): stop sending summary counts as strings on ranges over 24h by @GilbN in #426
- test(seed): seed traffic at real GeoLite2 locations by @GilbN in #427
- fix(ui): keep screen reader labels out of selected IPs by @GilbN in #433
- fix(map): stop Fly to on the map from taking over the next page on Back by @GilbN in #436
- fix(seed): seed only what ingestion writes and make --reset work on TimescaleDB 2.31 by @GilbN in #428
- feat(overview): chart each figure on the Overview cards by @GilbN in #434
- fix(timescale): count traffic that arrives after the six-hourly aggregate refresh by @GilbN in #429
- fix(shell): open the sidebar collapsed on a phone held sideways and keep it clear of the notch by @GilbN in #422
- feat(map): lay the phone map along the right edge on a phone held sideways by @GilbN in #423
- feat(ui): a floating tab bar replaces the phone sidebar by @GilbN in #435
- feat(ui): open panels on the right on wide phones held sideways by @GilbN in #437
- fix(analytics): headline the largest category on the Traffic origin card by @GilbN in #441
- ci: shard the smoke tests, split the backend job and fix a 60s test stall by @GilbN in #438
- feat(ui): fit the phone IP menu on one screen and open Ban in its own drawer by @GilbN in #444
- ci: delete closed PRs' caches and stop caching release builds by @GilbN in #442
- fix(ui): open a record sheet's IP actions in a drawer on phones by @GilbN in #443
- fix(ui): open the IP inspector's ban durations in a drawer on phones by @GilbN in #445
- feat(geo-logs): chart each figure on the Geo Logs cards by @GilbN in #446
- fix(map): stop map popups cutting off the left edge of marked IPs by @GilbN in #447
- perf(geo-logs): stop sending the same time-series query twice per page load and poll by @GilbN in #449
- feat(geo-logs): make the stat-card charts follow Chart buckets by @GilbN in #452
- feat(overview): make the stat-card charts follow Chart buckets by @GilbN in #453
- fix(ios): run the phone map behind the status bar in the installed app by @GilbN in #454
- fix(ui): make stat cards 24px shorter on tablets and desktops by @GilbN in #456
- fix(debug-logs): show stored headers as stored in the Fields view by @GilbN in #455
- fix(ios): fill the screen when the installed app opens by @GilbN in #457
- refactor(ios): drop the viewport restore after the keyboard closes by @GilbN in #458
- fix(ios): keep full-height sheets clear of the status bar by @GilbN in #459
- fix(ios): keep drawers and the focused field above the keyboard by @GilbN in #460
- fix(ios): stop the grey status bar band on the map and its sheets by @GilbN in #461
- feat(filters): replace the phone Filters scroll with compact rows by @GilbN in #463
- fix(phone): ask before logging out from the More menu by @GilbN in #465
- fix(ui): let phones read a badge's hover text with a tap by @GilbN in #464
- fix(analytics): keep Other out of the Traffic origin headline by @GilbN in #466
- feat(sidebar): remember whether the desktop sidebar is collapsed by @GilbN in #467
- docs(changelog): drop fixes for bugs that never shipped by @GilbN in #468
- fix(filters): stop a tap in device emulation picking a list option by @GilbN in #469
- chore(release): 0.24.0 by @GilbN in #471
- Release v0.24.0 by @GilbN in #472
Full Changelog: v0.23.0...v0.24.0